Organic Audit in Topical Authority
The Organic Audit (“Audit” tab in Topical Authority) connects your Google Search Console data to your Topical Map to show how Google Search actually sees your content. It maps real search queries and landing pages to your topical hierarchy so you can see which topics earn clicks and impressions and which are invisible to organic search.
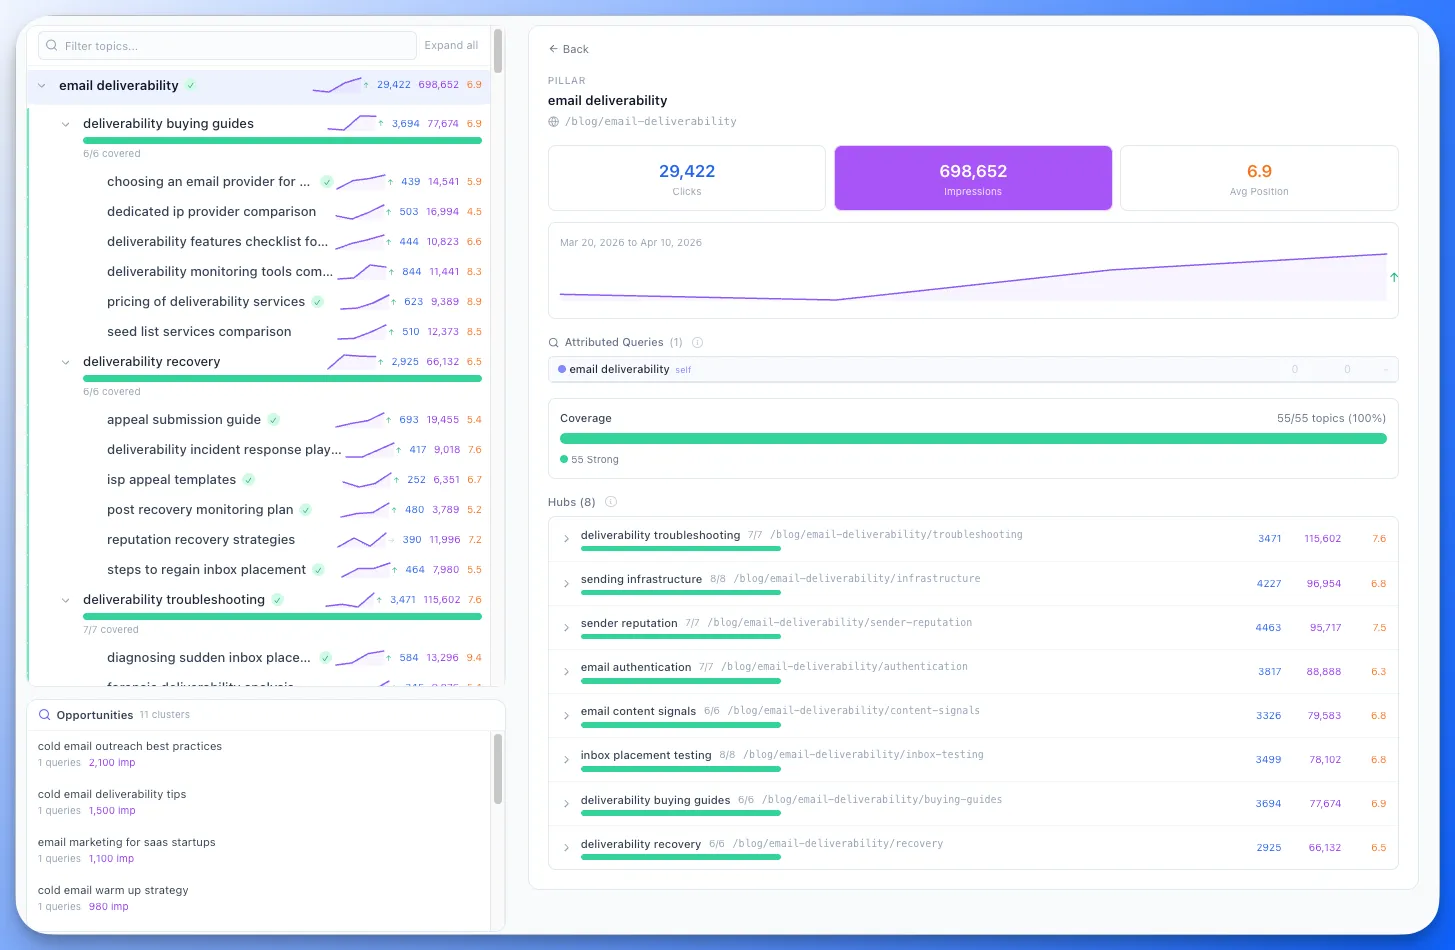
What You’ll Learn
Section titled “What You’ll Learn”- How to connect Google Search Console
- How to connect multiple Google accounts and pick the right property
- How to import GSC data
- Using the Priority view to find winners, losers, CTR gaps, and AI search blind spots
- Switching between By Topic and By Page views
- Understanding the hierarchy tree with GSC overlay
- Reading per-topic metrics (clicks, impressions, position)
- Understanding performance classifications
- Using opportunity clusters to find new topics
- Manually matching a page to a topic when attribution misses it
- Tracking trends over time with sparklines
- Using the Visual Map to see your entire topic map color-coded by GSC and AI search data
- Comparing your brand to a competitor with Side-by-Side and Gap Overlay modes
- Using GSC queries in the Content Optimizer to optimize toward real search demand
- Exporting your data
Getting Started
Section titled “Getting Started”Prerequisites
Section titled “Prerequisites”Before using the Organic Audit, you need:
- A completed Topical Map promoted into Topical Authority
- A Google Search Console property with verified access to your domain
- At least a few weeks of GSC data for meaningful analysis
Connecting Google Search Console
Section titled “Connecting Google Search Console”- Navigate to Topical Authority and select the Audit tab
- Click Connect Google Search Console
- Choose your Google account in Google’s account chooser and grant Floyi read-only access to your Search Console data
- In GSC Property, select the property (domain or URL prefix) that matches your brand’s website
You can also connect accounts from Settings > Integrations.
Connecting Multiple Google Accounts
Section titled “Connecting Multiple Google Accounts”If your sites live under different Google logins, as is common for agencies managing client properties, you can connect more than one Google account to the same workspace.
- In the Audit tab, click Add another account below your connected accounts (or use Add another account in Settings > Integrations)
- Pick the other Google account in Google’s account chooser and approve access
- Open the GSC Property dropdown. Properties are grouped under the Google account they belong to
The property dropdown is searchable. Type part of a URL or a Google email to narrow the list. Each property also shows that Google account’s access level in Search Console (Owner, Full user or Restricted user).
How accounts work across plans and workspaces:
| Personal workspace | Team workspace | |
|---|---|---|
| Who sees the accounts | Only you | Every team member |
| Who can add or remove accounts | You | Team Owners and Admins |
| Who can fetch data with them | You | Every team member |
- Free plan: one Google account per workspace. Any paid plan can connect as many as you need.
- Each brand remembers its account. The next time you open the Audit tab for a brand, Floyi selects the Google account and property you last fetched with, and the weekly refresh uses that same account.
- Reconnect needed: if Google access for an account expires or is revoked, the account shows Reconnect needed. An Owner or Admin clicks Reconnect to restore it, and brands keep using it without being set up again.
Importing Data
Section titled “Importing Data”Once connected, choose your property and date range, then click Fetch Search Data. Floyi imports your search queries and landing pages, then runs the attribution engine to map them to your topical hierarchy.
How Attribution Works
Section titled “How Attribution Works”The Organic Audit uses a smart matching system to connect GSC queries and pages to your topical map nodes:
- Exact keyword match — Query text matches a node’s name, tracking query or cluster keywords exactly (highest confidence)
- Stemmed keyword match — Matches different word forms automatically, so “optimizing” maps to “optimize” (high confidence)
- Semantic match — Semantic matching connects conceptually related queries to topics, even when the exact words differ (requires a high-confidence match to count)
Queries that don’t match any node are classified as either opportunities (potential new topics) or noise (irrelevant traffic).
Four Views: Priority, By Topic, By Page, and Map
Section titled “Four Views: Priority, By Topic, By Page, and Map”Once data is imported, the Audit tab splits into four views you can toggle between with the tabs at the top of the panel:
- Priority — actionable performance signals: winners and losers, below-average CTR topics, and topics missing from AI search. The fastest path from data to action.
- By Topic — the two-panel hierarchy view. Browse traffic organized by your topical map (pillars, hubs, topics).
- By Page — a flat, sortable table of every URL on your site that has GSC data. Useful for page-level audits, finding cannibalization, and manually fixing attribution.
- Map — your entire topic hierarchy as a visual map, color-coded by position, impressions, clicks, or AI search presence. Includes competitor comparison with side-by-side and gap overlay modes.
All four views read from the same underlying GSC import. Switching tabs is instant once data is loaded.
Priority View
Section titled “Priority View”The Priority view surfaces the most actionable signals from your GSC data so you can act without digging through the full hierarchy.
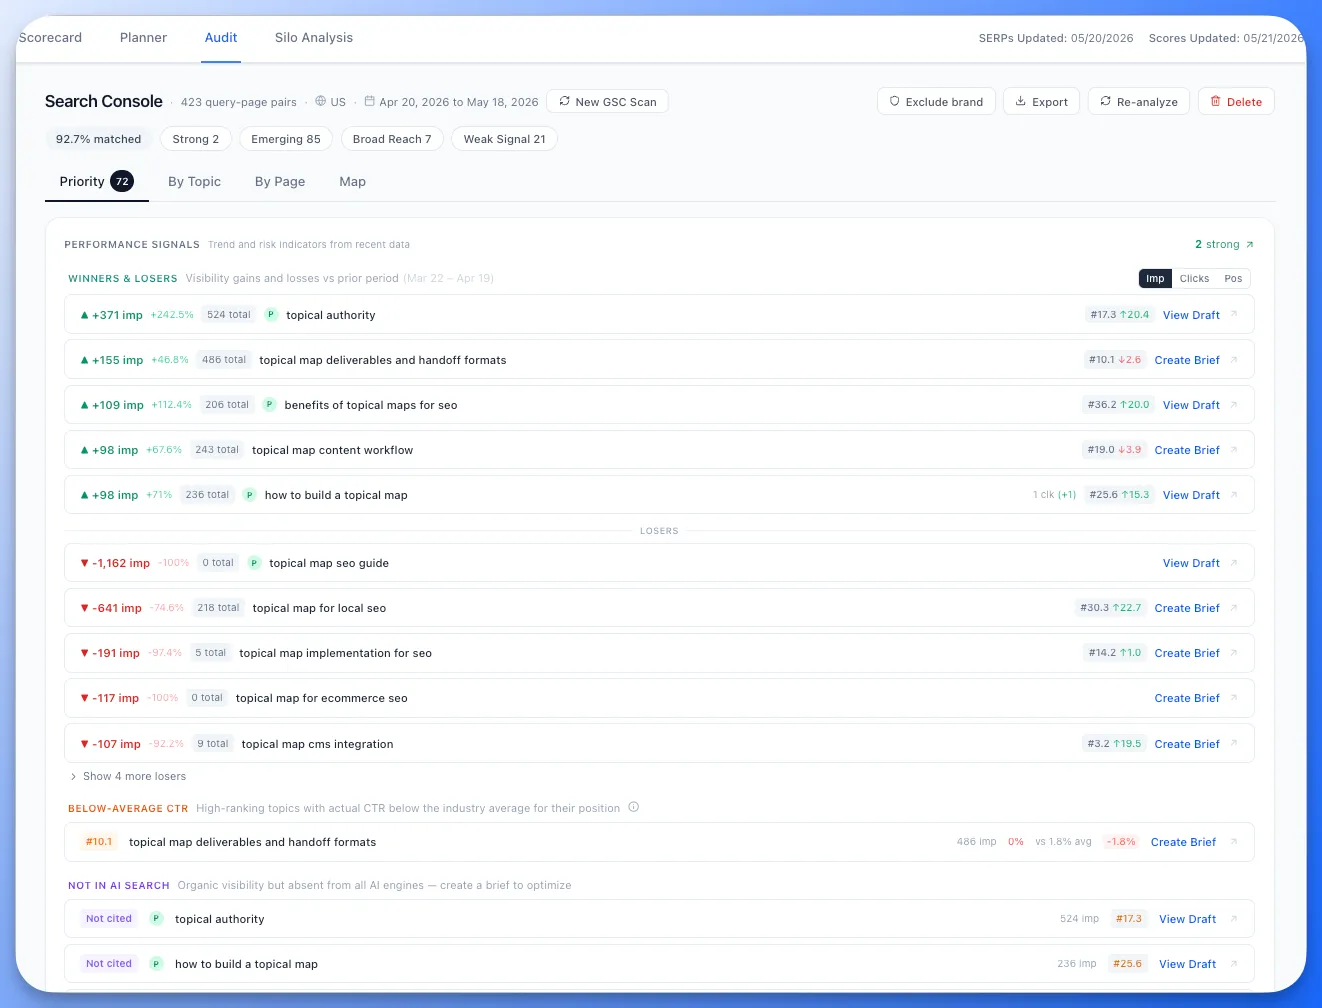
Performance Signals
Section titled “Performance Signals”The view opens with a count of strong topics (high-performing nodes) and organizes signals into three sections:
Winners & Losers
Section titled “Winners & Losers”Compares the current period against the prior period and surfaces topics with the largest impression gains (winners) and losses (losers). Each row shows:
- Delta — absolute and percentage impression change (green up arrow for gains, red down arrow for losses)
- Total impressions in the current period
- Published badge (P) when the topic has shipped content
- Position and position change on the right
- Click count when available
- Action button — View Draft, Create Brief, or Continue Draft depending on the topic’s current state
Toggle between Imp (impressions), Clicks, and Pos (position) to re-sort winners and losers by the metric that matters most. Losers are collapsed by default with a “Show N more losers” expander.
Below-Average CTR
Section titled “Below-Average CTR”High-ranking topics where actual click-through rate falls below the industry average for their position. These are topics where you rank well but your snippet or title is not compelling enough to earn the clicks your position should deliver. Each row shows the position, topic name, impressions, actual CTR, expected CTR, and the gap.
Not in AI Search
Section titled “Not in AI Search”Topics that have organic visibility (ranking in Google) but are absent from all AI search engines (AIO, AI Mode, ChatGPT, Gemini). These are opportunities to optimize for AI citation. Each row shows the AI status badge, published status, impressions, and position.
By Topic View
Section titled “By Topic View”The By Topic view displays your topical hierarchy as a two-panel layout:
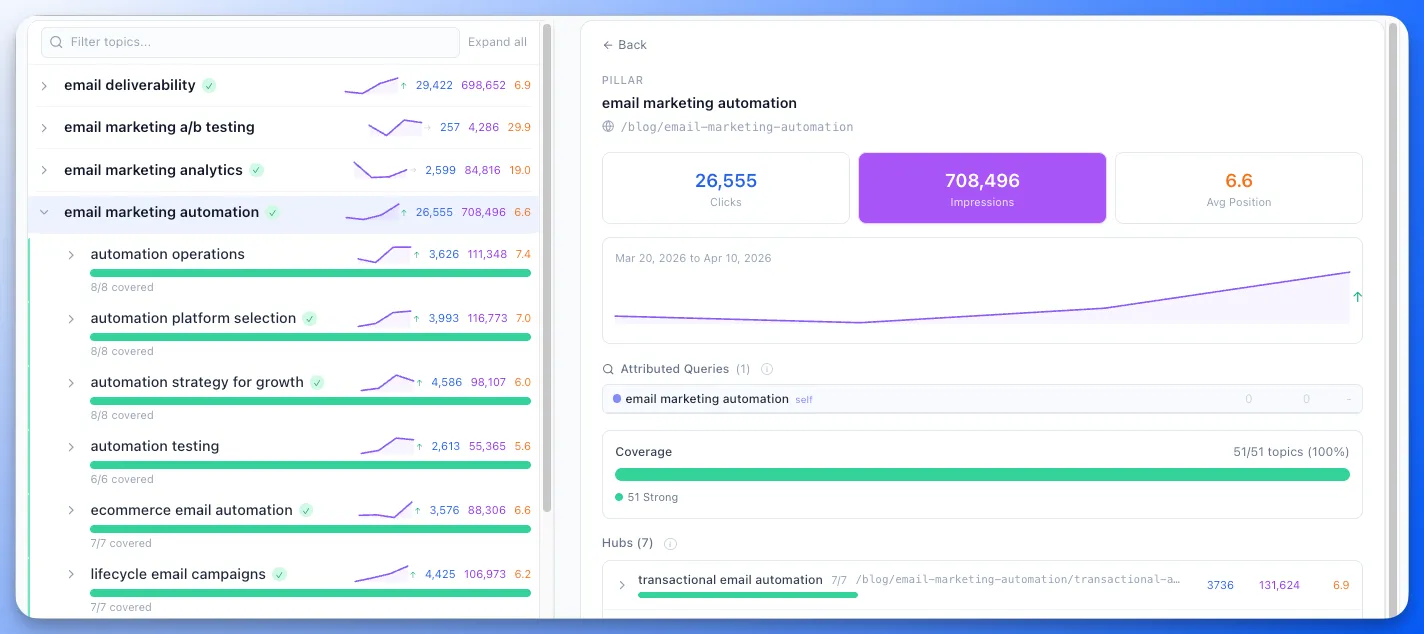
Left Panel: Hierarchy Tree
Section titled “Left Panel: Hierarchy Tree”Your topical map structure (pillars, hubs, topics) is displayed as a collapsible tree. Each node shows:
- Clicks and impressions from attributed GSC queries
- Coverage bar showing how many child topics have GSC data
- Matrix classification badge (Strong, Emerging, Broad Reach, Weak Signal)
- Confidence dots indicating how well queries match this topic
Use the matrix filter at the top to focus on specific classification types.
Right Panel: Detail View
Section titled “Right Panel: Detail View”Click any node in the tree to see its detail panel:
- Pillar detail — aggregate metrics across all hubs and topics in this pillar
- Hub detail — coverage and metrics for all topics under this hub
- Topic detail — individual query list, landing pages and match confidence scores
- Default overview — summary of total attributed clicks, impressions and top-performing topics
By Page View
Section titled “By Page View”The By Page view is a single full-width table that lists every URL with GSC data, sorted by impressions by default. This is the fastest way to scan page-level performance and fix attribution mistakes.
Columns
Section titled “Columns”| Column | What it shows |
|---|---|
| Page | The canonical URL. Click any row to expand it and see every query driving traffic to that page. |
| Topic Match | The topic node this URL was matched to during the most recent Audit. Empty if no match exists. |
| Clicks | Total clicks for the page in the imported date range. |
| Imp | Total impressions for the page. |
| Pos | Average position across all queries the page ranked for. |
Click any column header to sort. Click again to reverse direction. The page list is capped at the top 500 pages by impressions; an “(showing top 500)” hint appears when you exceed that.
Search and expand
Section titled “Search and expand”- A search field at the top filters pages by URL substring as you type.
- Click any row to expand it inline and see the full list of queries driving that page, with per-query clicks, impressions, and position.
- Only one row stays expanded at a time, so the list stays scannable.
Manual topic matching
Section titled “Manual topic matching”If automatic attribution didn’t link a URL to a topic, you can match it yourself. In a team workspace, manual matching is available to team Owners and Admins.
- Hover the empty Topic Match cell and click + Match.
- A popover opens with your topical map topics. Pick the right one.
- Optionally update the topic’s URL slug to this page’s path so future audits attribute it automatically.
- Save. The row updates immediately and other GSC views (the topic drawer, By Topic detail panels) refresh in the background.
To remove a manual match, hover the matched row and click the small × that appears next to the topic name. You’ll see an inline confirmation strip before the unmatch is committed.
Matching from the topic side
Section titled “Matching from the topic side”You can also create the same match from the topic details drawer in the Planner. Click the eye icon on any Resource-level topic, expand the Search Console section, and use + Match a URL to pick a URL with GSC data. Topic-side and page-side matches write to the same record — pick whichever direction is more convenient for the task at hand.
Performance Classifications
Section titled “Performance Classifications”Every topic with GSC data is classified into one of four categories based on two dimensions:
| Classification | Confidence | Volume | What It Means |
|---|---|---|---|
| Strong | High | High | Best-matched topics with real traffic. Maintain and build supporting content. |
| Emerging | High | Low | Right queries but low volume. May be growing or need promotion. Check indexing and internal links. |
| Broad Reach | High | High | Google sends traffic for loosely related queries. Create more focused content to tighten the match. |
| Weak Signal | Low | Low | Poor query match and low traffic. May not justify dedicated effort yet — monitor for changes. |
- Confidence is based on how closely the matched queries relate to the topic (keyword match strength and meaning-based relevance)
- Volume is based on total impressions for the attributed queries
Opportunity Clusters
Section titled “Opportunity Clusters”Queries that don’t match any node in your topical map are analyzed for patterns. Related unmatched queries are grouped into opportunity clusters that suggest potential new topics for your map.
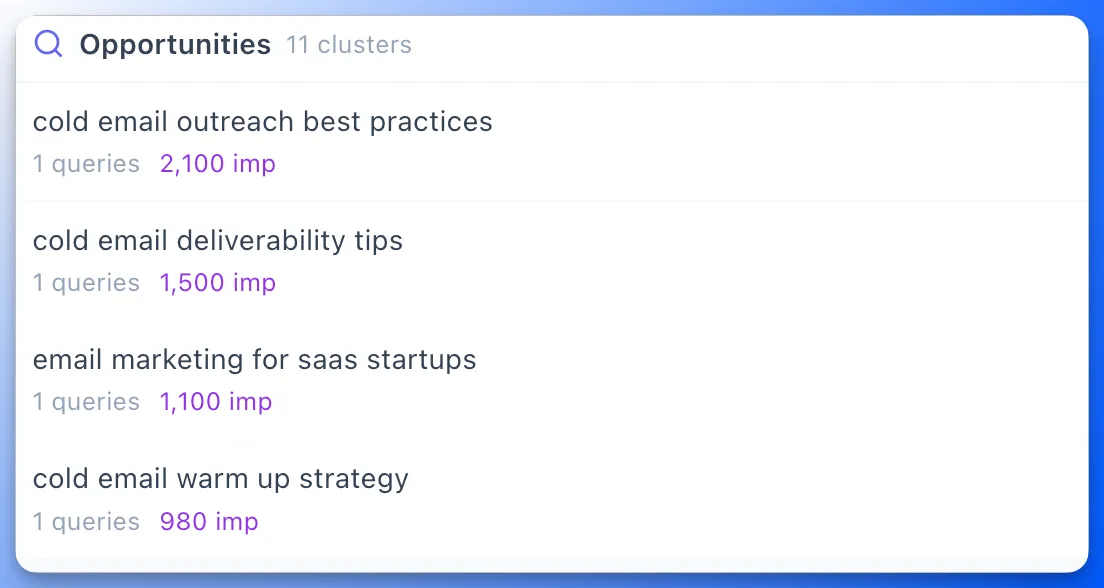
Each cluster shows:
- Cluster theme and representative queries
- Combined clicks and impressions
- An Add as New Topic button to add the cluster directly to your topical map
Sparkline Trends
Section titled “Sparkline Trends”After running multiple GSC imports over time, each topic shows a sparkline chart displaying impressions trends. This lets you see at a glance whether a topic’s organic visibility is growing, stable or declining without leaving the Audit tab.
Sparklines appear in the hierarchy tree next to each node that has historical data.
Visual Map
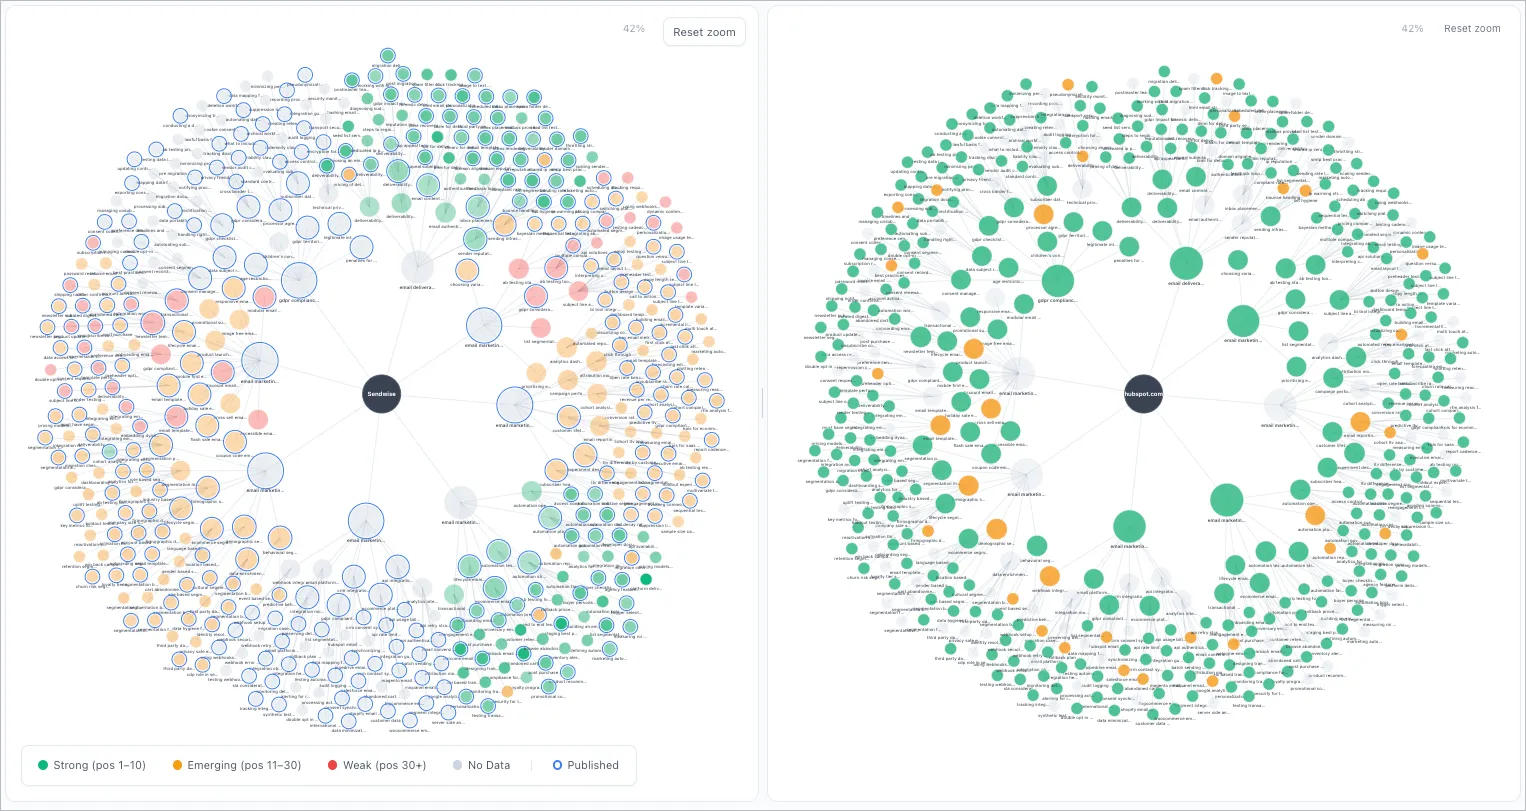
Section titled “Visual Map”The Visual Map tab shows your entire topical map overlaid with actual GSC results from the Organic Audit. Your brand sits at the center with pillars, hubs, branches, and resources radiating outward — sized by importance and color-coded by the metric you choose.
Color-by modes
Section titled “Color-by modes”Switch the Color by dropdown to change what the node colors represent:
| Mode | What it shows |
|---|---|
| Position | Green (ranks 1—3), Amber (4—10), Red (11—20), Slate (no SERP data) |
| Impressions | Green (high), Amber (medium), Red (low), Slate (no data) |
| Clicks | Green (high), Amber (medium), Red (low), Slate (no data) |
| AI Search | Purple (Cited), Light Purple (Mentioned), Amber (Not Present), Slate (no data) — across AIO, AI Mode, ChatGPT, and Gemini |
Published rings
Section titled “Published rings”Topics marked as published display a blue ring around the node, so you can see at a glance how much of your map has shipped content.
Interacting with the map
Section titled “Interacting with the map”- Hover any node to see a tooltip with topic name, level, importance, clicks, impressions, position, and AI search status.
- Click a node to select it and highlight its direct connections.
- Double-click a node to navigate to that topic in the Planner.
- Drag nodes to rearrange the layout. The layout pauses while you drag for precise positioning.
- Scroll to zoom in and out. Drag the background to pan.
Interactive legend
Section titled “Interactive legend”Click any swatch in the legend to filter the map to that category only. Click again to clear the filter. The Published filter isolates only nodes with shipped content.
Refreshing the map
Section titled “Refreshing the map”Click the refresh icon in the stats bar to re-fetch GSC summary data from the backend. The graph remounts with fresh published status, positions, and AI search data.
Competitor Comparison
Section titled “Competitor Comparison”Compare your brand’s Visual Map to any tracked competitor domain using two modes:
Side-by-Side mode places your brand’s map on the left and a competitor’s data on the right, rendered on the same topology with identical node positions. Differences in ranking and AI search presence jump out at a glance.
Gap Overlay mode recolors a single map by who wins each topic:
| Color | Meaning |
|---|---|
| Green | You outrank the competitor |
| Red | The competitor outranks you |
| Blue | Both rank (contested territory) |
| Gray | Neither ranks |
To activate competitor comparison:
- Click the Compare dropdown in the controls bar (next to the Color by dropdown).
- Choose Side-by-Side or Gap Overlay.
- Select a competitor domain from the dropdown that appears.
In side-by-side mode, the panels are resizable — drag the center divider to allocate more space to either panel. Zoom and pan on the left (brand) panel and the competitor panel follows in lockstep. You can also zoom independently on the competitor panel.
Hover any node on the competitor panel to see their best SERP position, all ranking URLs, and AI search status (AIO, AI Mode, ChatGPT, Gemini).
Metrics Strip
Section titled “Metrics Strip”At the top of the Audit tab, a metrics strip shows aggregate numbers:
- Total clicks across all attributed queries
- Total impressions across all attributed queries
- Attribution coverage — percentage of GSC rows matched to your topical map
- Date range of the imported data
Exporting Data
Section titled “Exporting Data”Click the Export button to download your GSC attribution data as CSV. The export includes:
- Node name and hierarchy level
- Clicks, impressions and average position per topic
- Matrix classification
- Top queries per topic with individual metrics
- Match type and confidence scores
Use exports for client reports, stakeholder presentations or offline analysis.
GSC Queries in the Content Optimizer
Section titled “GSC Queries in the Content Optimizer”When you open a published page in the Content Editor & Optimizer, the GSC Queries tab automatically pulls in the same Search Console queries attributed to that URL during your Organic Audit. This lets you optimize your content directly toward the queries searchers actually use to find your page.
Inside the GSC Queries tab you can:
- See a green check next to every query your draft already covers
- Click Highlight All to visually mark all GSC queries in your content at once, making coverage gaps obvious
- Copy any query to your clipboard for quick reference while editing
- Hover column headers for tooltip explanations of each metric
The connection is automatic — once you connect Google Search Console in the Organic Audit, any page with GSC data will show its queries in the Content Optimizer without extra setup.
Re-scanning and Refreshing
Section titled “Re-scanning and Refreshing”You can run a new GSC fetch at any time to get fresh data. Previous imports are kept for trend comparison. The Organic Audit automatically detects when attribution needs re-running (for example, after topical map changes) and prompts you to refresh.
In a team workspace, Re-analyze, Delete and manual topic matching are available to team Owners and Admins. Members can view all Search Console data and fetch new data with the team’s connected accounts.
Frequently Asked Questions
Section titled “Frequently Asked Questions”Do I need to connect GSC to use Topical Authority?
Section titled “Do I need to connect GSC to use Topical Authority?”No. The Organic Audit is optional. Scorecard, Planner, Silo Analysis, and the Visual Map work independently using SERP and AI search data. The Organic Audit adds a layer of validation by showing how Google’s actual search data aligns with your strategy.
How often should I run a GSC import?
Section titled “How often should I run a GSC import?”Monthly imports give you good trend visibility. Weekly is useful during active content campaigns. The date range selector lets you control how much data to import.
Why do some topics show no GSC data?
Section titled “Why do some topics show no GSC data?”Topics with no attributed GSC data either have no published content yet or their published content is not appearing in Google Search results for related queries. This is valuable signal — it tells you where your map has gaps in organic visibility.
When should I use which view?
Section titled “When should I use which view?”Use Priority when you want to act fast — it surfaces the most important signals (winners, losers, CTR gaps, AI search blind spots) with one-click action buttons.
Use By Topic when you’re thinking strategically — which pillars are weak, which hubs need more coverage, which topics deserve a refresh.
Use By Page when you’re doing page-level work — auditing a specific URL, fixing a missed attribution, scanning for thin pages with high impressions but no clicks, or finding cannibalization where multiple pages compete for the same topic. By Page is also where you can manually match a URL to a topic when automatic attribution misses it.
Use Map when you want a visual overview of your entire topic hierarchy at a glance — spot clusters of weak or strong nodes, see which areas have published content, compare your coverage to a competitor (side-by-side or gap overlay), and present map health to stakeholders.
How is this different from Topical Audit?
Section titled “How is this different from Topical Audit?”| Feature | Organic Audit | Topical Audit |
|---|---|---|
| Purpose | See how Google Search sees your topics | Discover structure of any site |
| Data Source | Google Search Console | Website crawl |
| Requires Map | Yes | No |
| Best For | Validating your strategy with real search data | Competitor research |
| Output | Clicks, impressions, position per topic | Discovered hierarchy |
How do GSC queries show up in the Content Optimizer?
Section titled “How do GSC queries show up in the Content Optimizer?”When you open a published page in the Content Editor & Optimizer, the GSC Queries tab automatically displays the Search Console queries for that URL. You can see which queries your draft covers, highlight all of them in your content at once, and copy individual queries for reference. No extra setup is needed beyond connecting GSC in the Organic Audit.
What is the Visual Map?
Section titled “What is the Visual Map?”The Visual Map shows your entire topical map overlaid with actual GSC results. Nodes are sized by importance and color-coded by SERP position, impressions, clicks, or AI search presence. Published topics show a blue ring. Click any node to highlight its connections, double-click to jump to that topic in the Planner, and use the legend to filter by category. Competitor Comparison lets you view any tracked competitor’s data side-by-side on the same topology, or switch to Gap Overlay to see a single map colored by who wins each topic. It reads the same GSC, SERP, and AI search data as the rest of Topical Authority — no extra credits.
What permissions does Floyi need for GSC?
Section titled “What permissions does Floyi need for GSC?”Floyi requests read-only access to your Search Console data. It cannot modify your GSC settings, submit URLs or make any changes to your Google account.
Can I connect more than one Google account?
Section titled “Can I connect more than one Google account?”Yes. Click Add another account in the Audit tab or in Settings > Integrations. The Free plan includes one Google account per workspace, and any paid plan can connect as many as you need. Properties from every connected account appear in one searchable dropdown, grouped by account.
Who can see and use the Google accounts I connect?
Section titled “Who can see and use the Google accounts I connect?”In your Personal workspace, only you. In a team workspace, every team member can see the connected accounts and fetch data with them, but only Owners and Admins can add or remove accounts. Connecting an account in your Personal workspace doesn’t add it to any team.