
A 42-map study of 535,239 Google rankings and 354,955 AI citations.
Topical authority is one of the most repeated ideas in SEO and one of the least measured. Everyone agrees a website should cover its subject broadly and deeply. Far fewer can say what that breadth and depth are worth, and nobody has shown what it does now that AI answers sit on top of the results.
So we measured it, and published the result here in Floyi Research. Websites compete for two kinds of visibility now: appearing in Google’s results, and being cited in answers from AI search engines. This study covers four of them, called AI engines throughout: Google AI Overviews, Google AI Mode, ChatGPT, and Gemini.
There is no single standard way to measure topical authority across websites, so we studied a narrower, observable signal called ranked coverage. Ranked coverage is how often a website appears in Google’s top 20 across the topics in a topical map.
Our Central Thesis: Across a defined topical scope, websites that rank for more queries tend to be cited more often by AI, including for queries where they do not appear in the top 20.
Correlations here are Spearman’s rank correlation, explained in Terminology below. They show how closely two measurements move together, not that one caused the other.
Two earlier studies frame this one. The first found that most teams consolidate a topical map to three levels once search intent is validated. The second measured what filling one costs per published article.
Key Findings
- 97.2% of the websites ranking inside a topical map rank in the top 20 for less than 5% of the topics. They still hold 63.1% of all the map’s top-20 positions, one position at a time.
- Websites ranking for at least half of a map’s topics were cited in 30.8% of its citing AI Overviews on average, against 0.14% for websites ranking for less than 5% of them. The same rise held on all four AI engines.
- Websites that ranked for more queries within a topical map were also cited in more AI answers on all four AI engines. The correlation ran from 0.33 on ChatGPT to 0.51 on AI Overviews.
- 40.2% to 71.9% of AI citations for a query went to websites that did not rank in the top 20 for the query being answered, across all four AI engines.
- 26.8% to 43.7% of AI citations went to websites that did not rank for that query, but did rank elsewhere in the same map. The remaining 12.7% to 28.2% went to websites that ranked nowhere in that map at all.
- Ranking for more of a map’s topics did not improve a website’s odds on a query it already ranked for. But it did improve its odds on queries it did not rank for, on all four AI engines. A website ranking for topics A, B and C was more likely to be cited on topic D, which it did not rank for, than a website ranking for A alone. The correlation ran from 0.18 on ChatGPT to 0.37 on AI Overviews, and the direction was consistent throughout.
- A higher number of rankings across a topical map was more closely tied to a website’s AI citation presence than Domain Rating was on all four AI engines: 0.51 against 0.09 on AI Overviews, 0.48 against 0.16 on AI Mode, 0.33 against 0.15 on ChatGPT, and 0.36 against 0.11 on Gemini.
The Questions We Asked
- How are Google rankings distributed across the websites inside a topical map?
- Are websites with broader ranked coverage cited across a larger share of AI answers?
- Do AI citations follow the exact query’s top 20, the wider topical map or neither?
- Does ranked coverage track AI citations more closely than Domain Rating?
Sections 1 through 4 answer them in order.
The Dataset at a Glance
- 42 topical maps across six industries
- 29,319 topics
- 535,239 top-20 Google positions
- 110,169 ranking websites
- 354,955 AI citations across the four AI engines - AI Overview, AI Mode, ChatGPT, and Gemini
Terminology
Every number in this study depends on how these terms are defined, so here is what each one means here.
Topical map is the structured set of topics a brand needs to cover to serve its target audience. Each map is built for one brand, so it’s not a random keyword list or a web-wide sample. No two maps are the same.
Topical scope is how far one map reaches: which topics are inside it and how many. A map with 500 topics has a scope of 500 topics, and every coverage percentage in this study is measured against that number.
“Top 20” means page one and page two of Google’s results, which is what we captured for each query. A Google page doesn’t always carry 10 organic results, so a query yielded 18.3 results on average. A website not in those two pages may still rank below them.
Ranked coverage is the share of a map’s topics where a website holds a top-20 Google position. Imagine a map with 500 topics. A website ranking for 100 of them has 20% ranked coverage. If an AI answer cites that website for a topic where it doesn’t rank in the top 20, that is an off-query citation. It doesn’t measure how much content the website published, whether that content is good or why the website earned its rankings or citations.
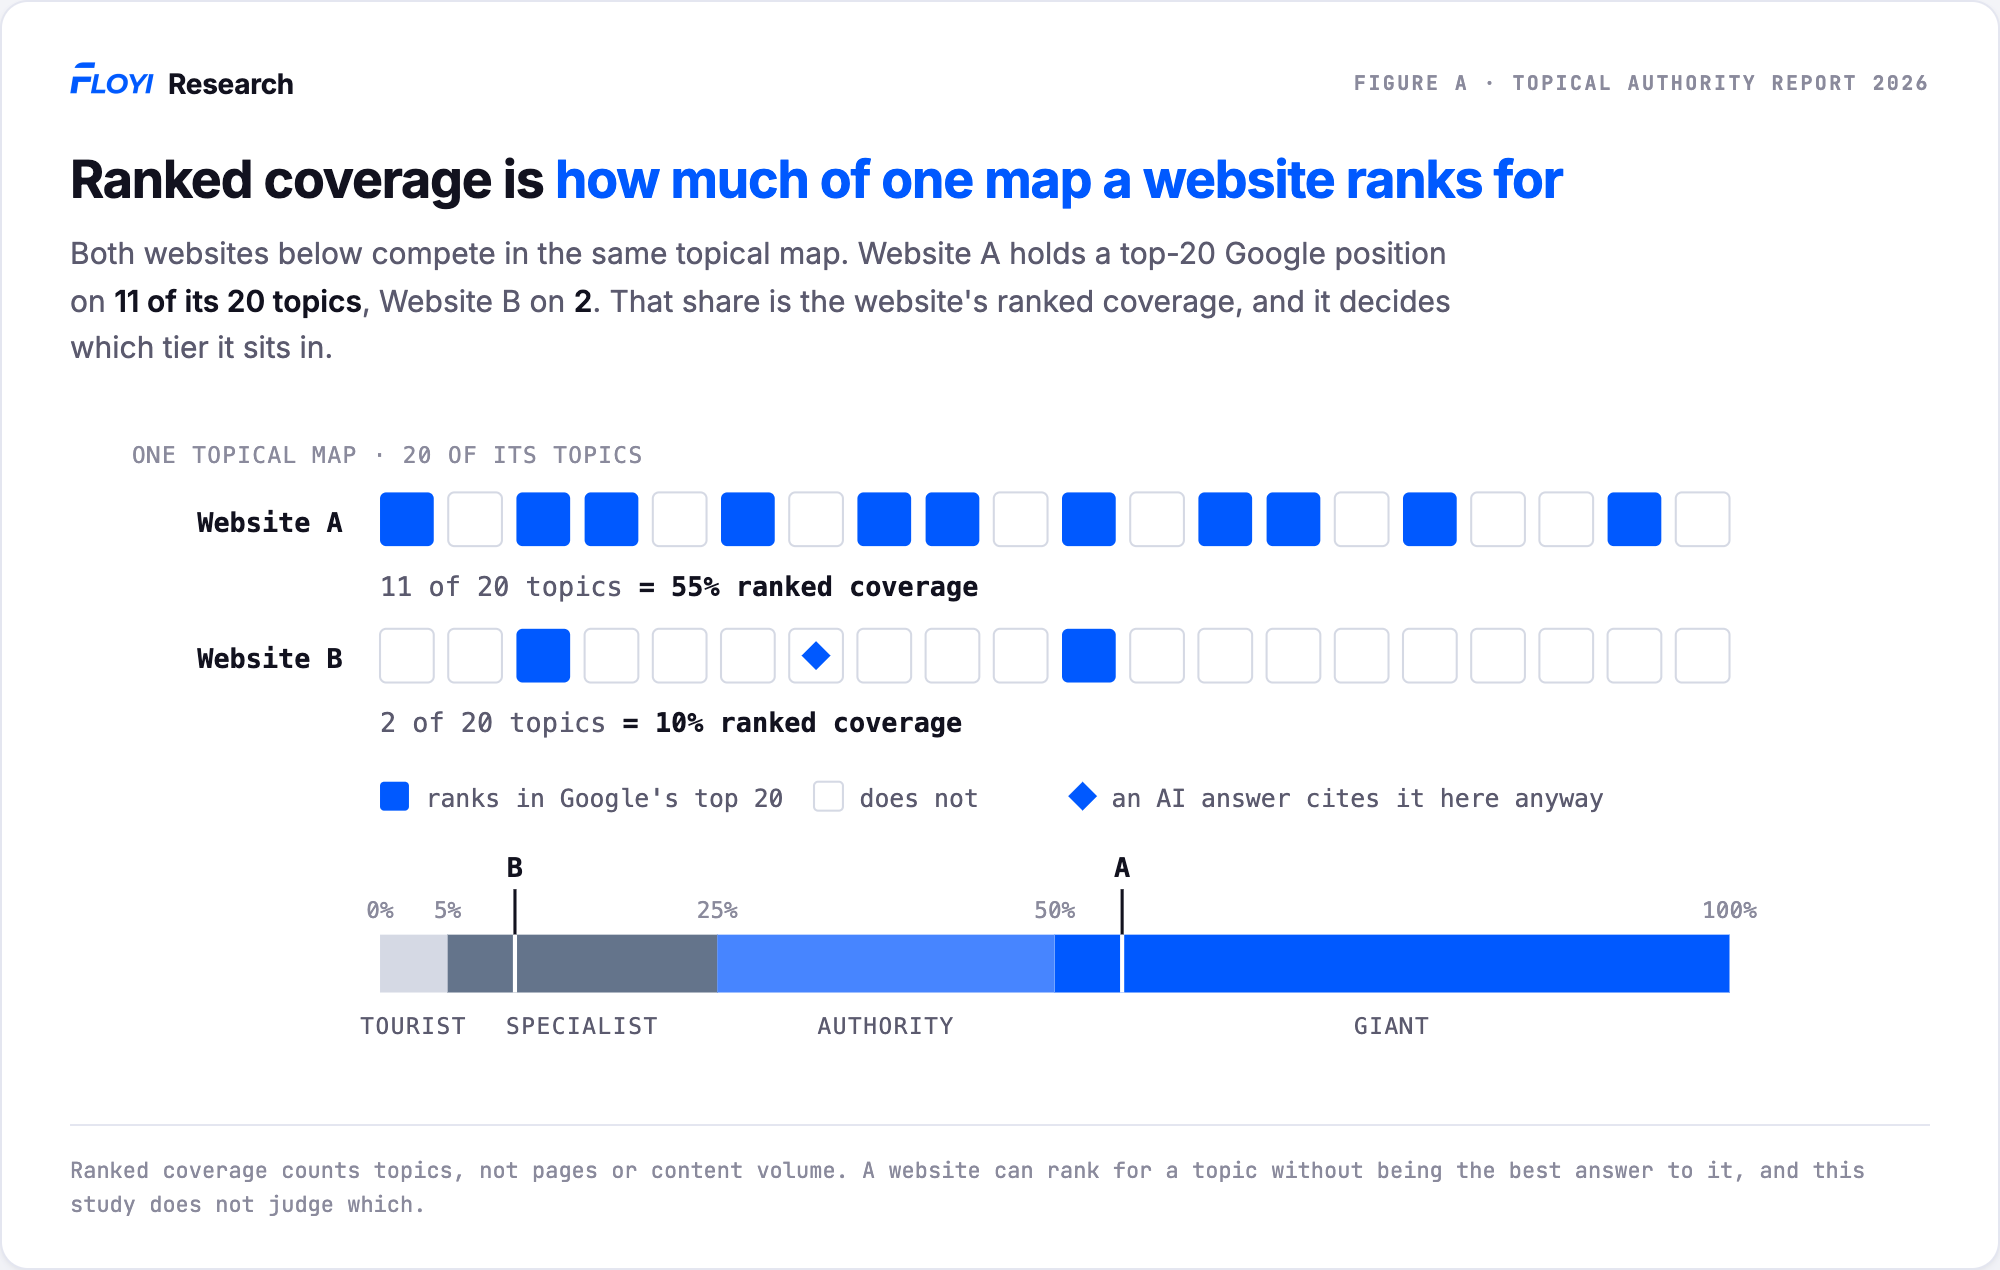
Figure A. How ranked coverage works.
Topic, keyword and query are three different things. A topic is one subject a website covers with one page. Floyi builds a topic by clustering keywords that serve the same search intent, so one topic can gather many keyword variants. A query is the one keyword in that cluster that stands for the topic, also known as its head term.
This study tracked one query per topic, so the 29,319 queries here are 29,319 topics rather than a list of every keyword a website might rank for. Listing every keyword variant could skew the results for topics that have dozens of variants all delivering similar SERPs and AI answers.
A website is one hostname as Google returned it. blog.example.com and shop.example.com count separately. example.com/blog and example.com/shop count as one website.
The platform group is a fixed list of 20 large sites that rank across almost any topic: YouTube, Reddit, Facebook, Wikipedia, Amazon and Yelp are the clearest examples. They represent social networks, user-generated-content sites, academic databases, and large cross-topic publishers.
Platforms hold 13.8% of all top-20 positions in the study. Because they turn up everywhere, several results below are reported twice, once with platforms and once without. That allows us to see findings that aren’t just a YouTube or Reddit effect.
Non-platform means every other website: businesses, publishers, government portals, universities. The full platform list is in Appendix B.
A citation is one website URL cited in one AI answer, counted once per answer no matter how often that answer repeats the link. Five URLs from one domain in one answer are five citations and one cited website. The same URL cited in five different answers counts five times.
For AI Mode, ChatGPT and Gemini, only URLs the engine marked as cited count in a Sources list. AI Overview reference links have no separate Sources list, so every distinct reference URL counts.
A mention is a website named in the answer text, whether or not the answer links to it. Being named isn’t the same as being recommended. A mention counts a recommendation, a passing reference, a comparison against a competitor and a criticism alike, because this study detects the name and not the sentiment around it. A website named as the weaker option in a comparison counts exactly the same as one named as the best choice.
A correlation isn’t a percentage. Spearman’s rank correlation asks who is ahead of whom, not by how much. Line up every website in a map from most ranked topics to fewest, then line them up again from most AI citations to fewest. The correlation measures how closely those two lists match. Only the order counts, so it makes no difference whether the leading website ranks for twice as many topics as the next one or ten times as many.
A 0.51 correlation doesn’t mean a 51% chance of being cited. A negative value would mean the two lists run in opposite directions. For the chance of being cited, see the position rates in Section 3. For example, a website in positions 1 to 3 was cited in 60.7% of the AI Overviews it was eligible for.
Mean and median run throughout. When a table shows a value such as “30.8% (29.1%),” the first number is the mean and the number in parentheses is the median. The figures carry means only, so no chart asks you to hold two summaries at once. A column of means adds to 100% where the tiers divide a whole; a column of medians does not have to, because each tier’s median is taken separately. And the map’s number of topics isn’t the denominator for every percentage: each table says what it counts.
1. 97.2% of the Websites in a Topical Map Rank for Less Than 5% of the Topics
Each topical map in this study contains an average of 3,204 websites that hold a top-20 position for at least one query, and the median is 2,061.5. Sizes range from 578 to 12,844 websites.
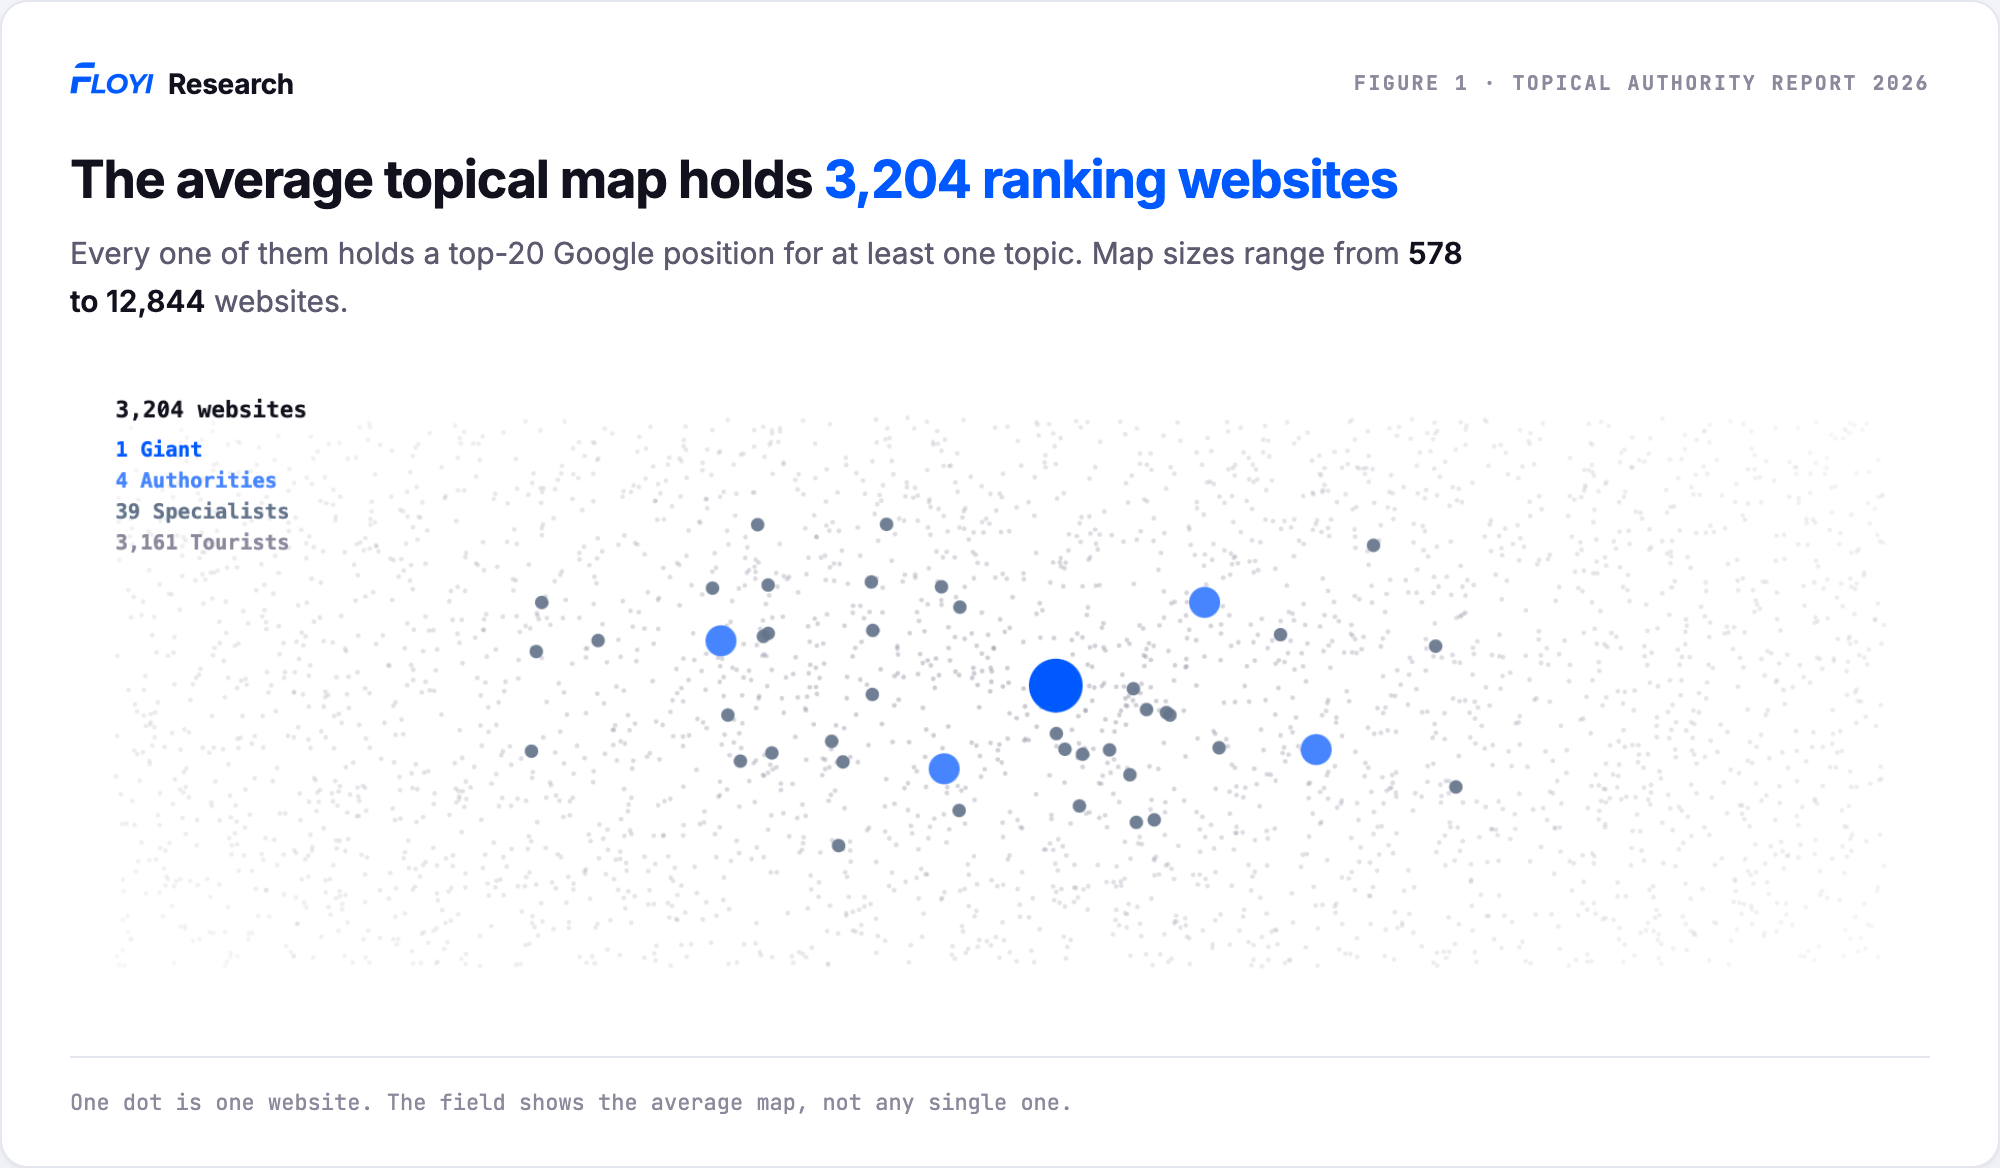
Figure 1. Ranked website distribution across the 42 maps.
We grouped websites into four tiers based on the share of a map’s queries where they ranked in the top 20 - Giant, Authority, Specialist, Tourist.
These names describe ranking coverage only. They don’t score content quality, expertise or trust.
The distribution is bottom-heavy. The average map holds 1.1 Giants, 3.5 Authorities, 38.6 Specialists and 3,161 Tourists, so Tourists make up 97.2% of its ranking websites.
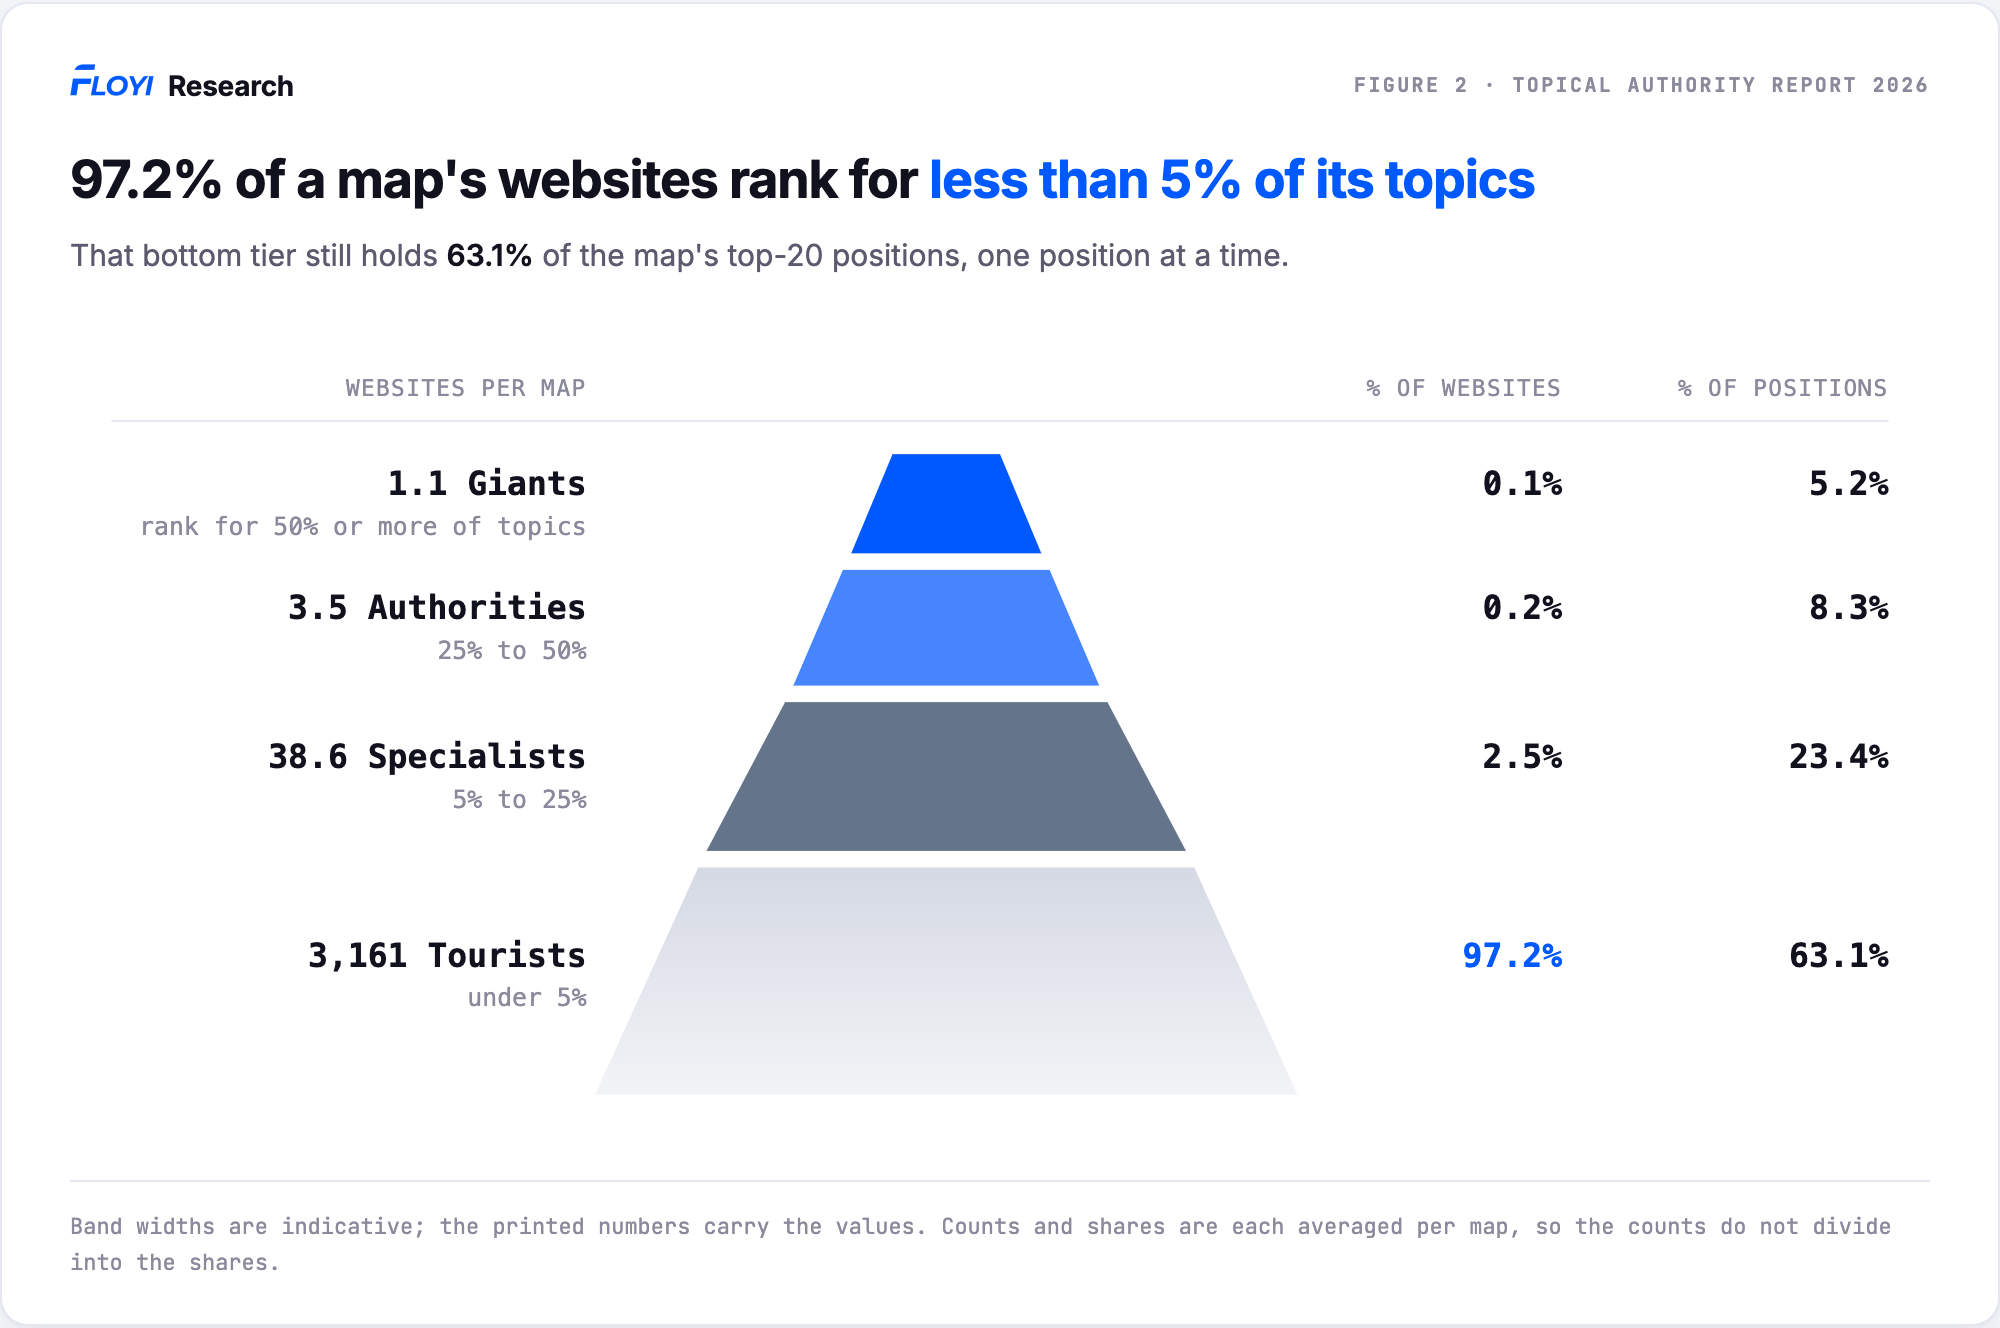
Figure 2. Ranked-coverage tiers across the 42 maps.
| Tier | Ranks in the top 20 for | Websites | Share of the map’s websites | Share of its top-20 positions |
|---|---|---|---|---|
| Giant | 50% or more | 1.1 (0) | 0.1% (0.0%) | 5.2% (0.0%) |
| Authority | 25% to 50% | 3.5 (3) | 0.2% (0.1%) | 8.3% (7.3%) |
| Specialist | 5% to 25% | 38.6 (38) | 2.5% (1.6%) | 23.4% (23.4%) |
| Tourist | Less than 5% | 3,161 (2,016.5) | 97.2% (98.3%) | 63.1% (62.4%) |
Websites appearing in the top 20 for at least 5% of a map make up only 2.8% of websites in the average map, but they hold 36.9% of all available top-20 positions.
At the website level, one website’s share of its own map’s top-20 positions comes to:
- Giant 4.8% (4.3%)
- Authority 2.4% (2.1%)
- Specialist 0.6% (0.5%)
- Tourist 0.03% (0.01%)
The median sits below the mean in every tier because a few unusually broad websites pull each average up. The average Giant holds 618 of its map’s top-20 positions, the average Authority 331, the average Specialist 75 and the average Tourist 2.3.
The same structure held in all six industry groups. The average Media and Affiliate map has 8.2 websites ranking for at least a quarter of its topics against 3.3 for B2B and SaaS, and Tourists are 95.1% to 97.9% of the ranking websites everywhere.
Figure 3. Organic structure by industry.
| Category | Websites in map | Authorities + Giants | Tourist share of websites | Websites holding half the positions |
|---|---|---|---|---|
| B2B & SaaS | 3,512 | 3.3 | 97.9% | 187 |
| Local & Regional Services | 3,008 | 4.4 | 97.0% | 206 |
| E-commerce & DTC | 3,576 | 5.0 | 97.6% | 136 |
| Media & Affiliate | 2,354 | 8.2 | 95.1% | 114 |
| Health & Wellness | 2,574 | 4.7 | 97.5% | 107 |
| Travel & Experiences | 3,759 | 5.3 | 96.3% | 112 |
The categories are shown to demonstrate that the pattern recurs in each of them, not to rank industries against one another. Some hold only a handful of maps.
The top is also unusually small. No map had more than 11 Authorities and Giants combined or more than 10 Authorities alone.
The dataset contains 110,169 ranking websites. Only 19 are a Giant in any map. Those websites account for 45 Giant placements because one website can qualify in more than one map, like reddit.com.
6 of those 19 are platform sites and 13 are not. The platform group is a fixed list chosen in advance, while the Giants are a measured result. Being on the list doesn’t make a website a Giant: 14 of the 20 platform sites never rank for half of any map, Wikipedia, Amazon and Yelp among them.
Of the 45 placements, 32 belong to the 6 platform Giants and 13 to non-platform websites. In total, 33 of 42 maps have no non-platform website ranking for at least half of the map.
The platform group takes 13.8% of all top-20 Google positions and 5.4% to 12.7% of website citations across the four AI engines.
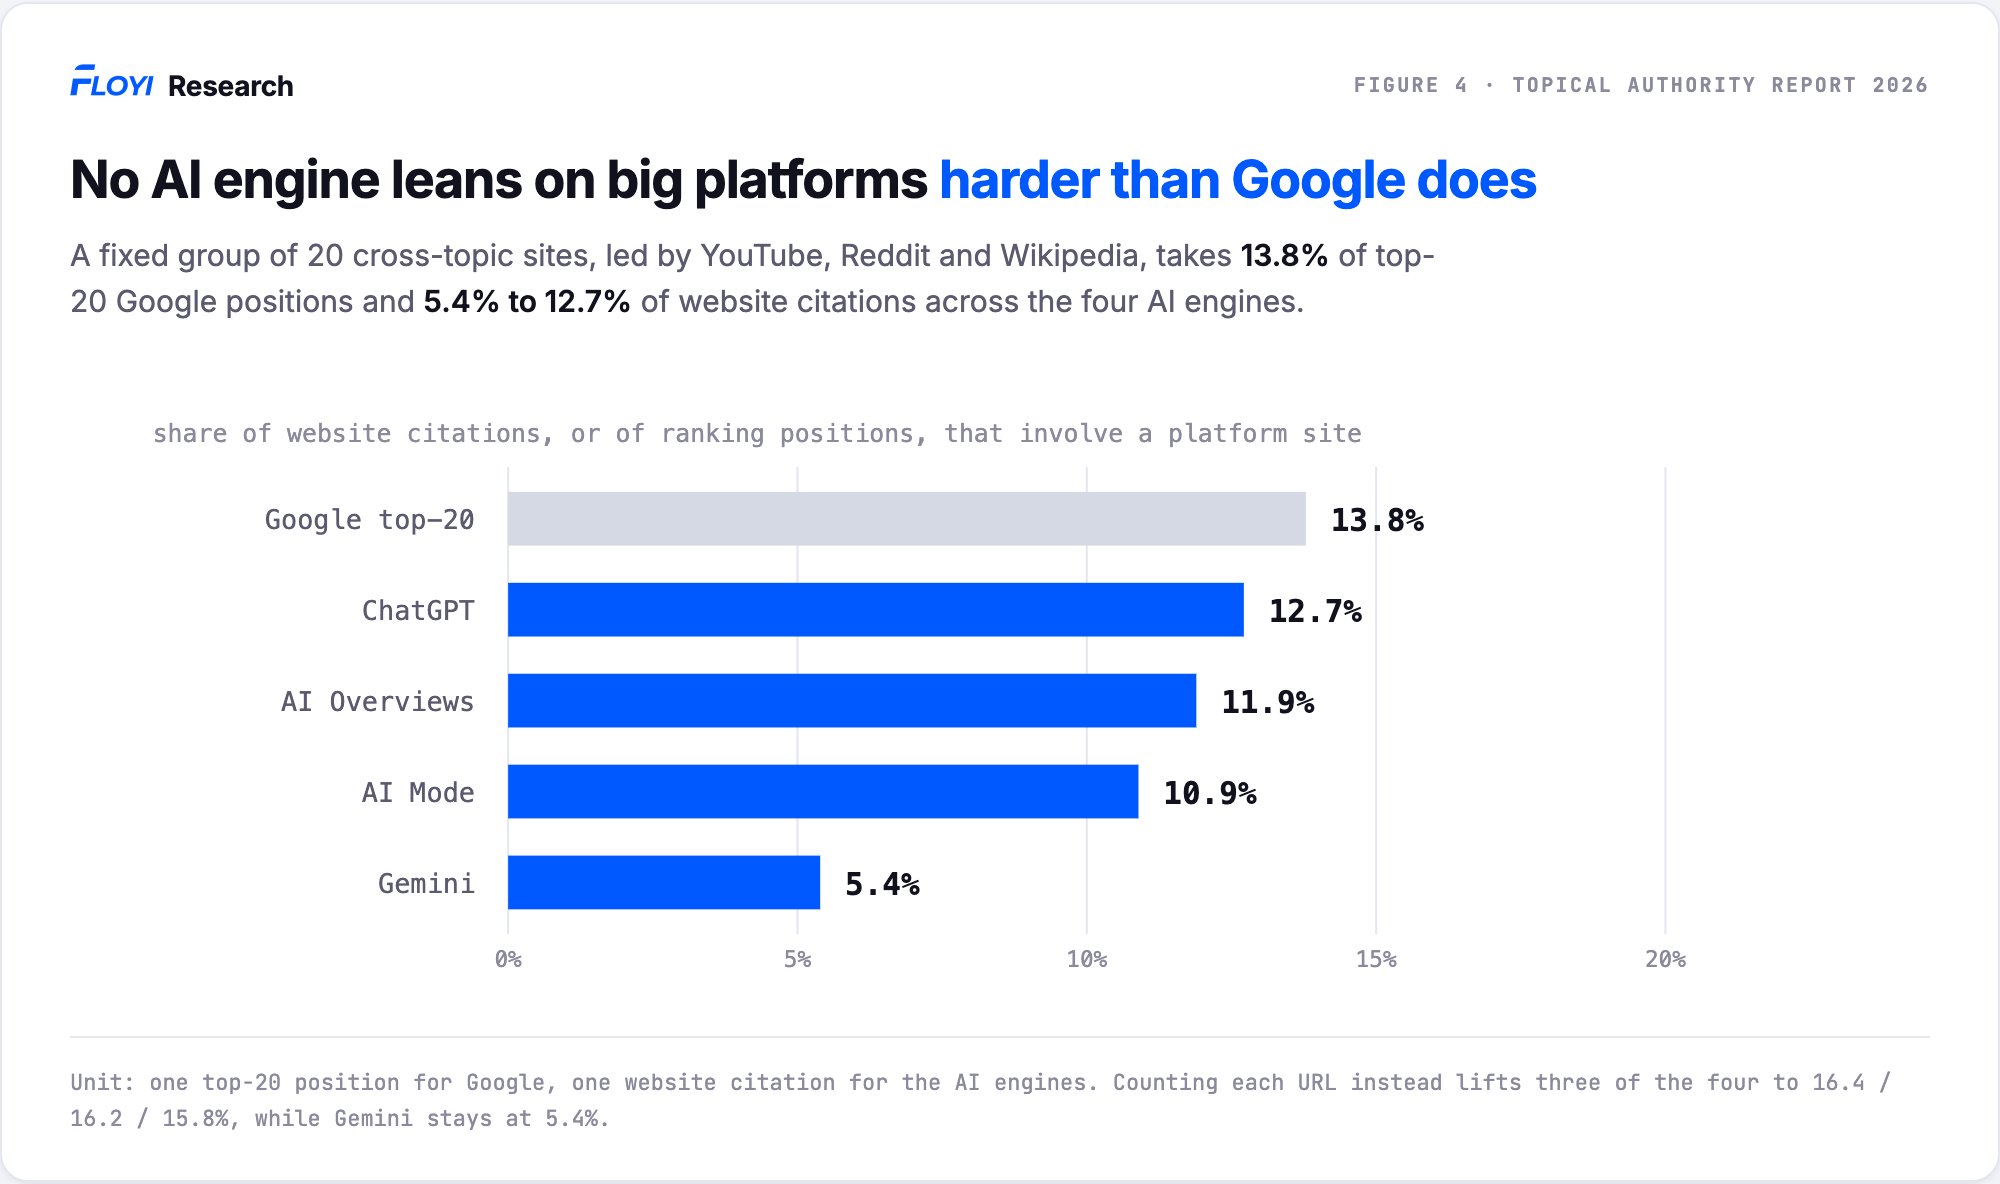
Figure 4. Platform share of Google positions and website citations.
YouTube is a Giant in 12 maps, Reddit in 9 and Facebook in 6. The fixed list, with the position and Giant counts behind those numbers, is in Appendix B.
The tiers describe ranked visibility, not business quality, content quality or a growth path this study demonstrates. A website marked as missing from the top 20 may still rank below the captured window.
Ranked coverage is not the Coverage score Floyi reports inside Topical Authority. Along with ranking, that score also weights a topic by whether the brand has published for it, and it sits inside a wider score built from content, market and AI signals. This study measures rankings and nothing else, and the two are deliberately kept apart. A website can rank without a dedicated page, and publish a page that never ranks.
So the websites competing inside a map split sharply. A few dozen hold real coverage of it, and thousands rank for only a topic or two. The next section asks which of them AI answers actually cite.
2. Websites Ranking for at Least Half of a Map’s Topics Were Cited in 30.8% of Citing AI Overviews on Average
In every usable map on every AI engine, websites that ranked for more of the map’s topics were also cited in more AI answers. We calculated the relationship inside each map, then summarized the results across maps.
The within-map rank correlation, as mean (median):
- 0.51 (0.52) for AI Overviews
- 0.48 (0.46) for AI Mode
- 0.33 (0.30) for ChatGPT
- 0.36 (0.43) for Gemini
A positive rank correlation means that websites with broader ranked coverage tended to be cited in more AI answers. However, it doesn’t show that broader ranked coverage caused those citations.
The same rise appears when the websites are grouped into ranked-coverage tiers. On AI Overviews, a Giant is cited in 30.8% of the citing answers in its own map, an Authority in 16.5%, a Specialist in 4.4% and a Tourist in 0.14%.
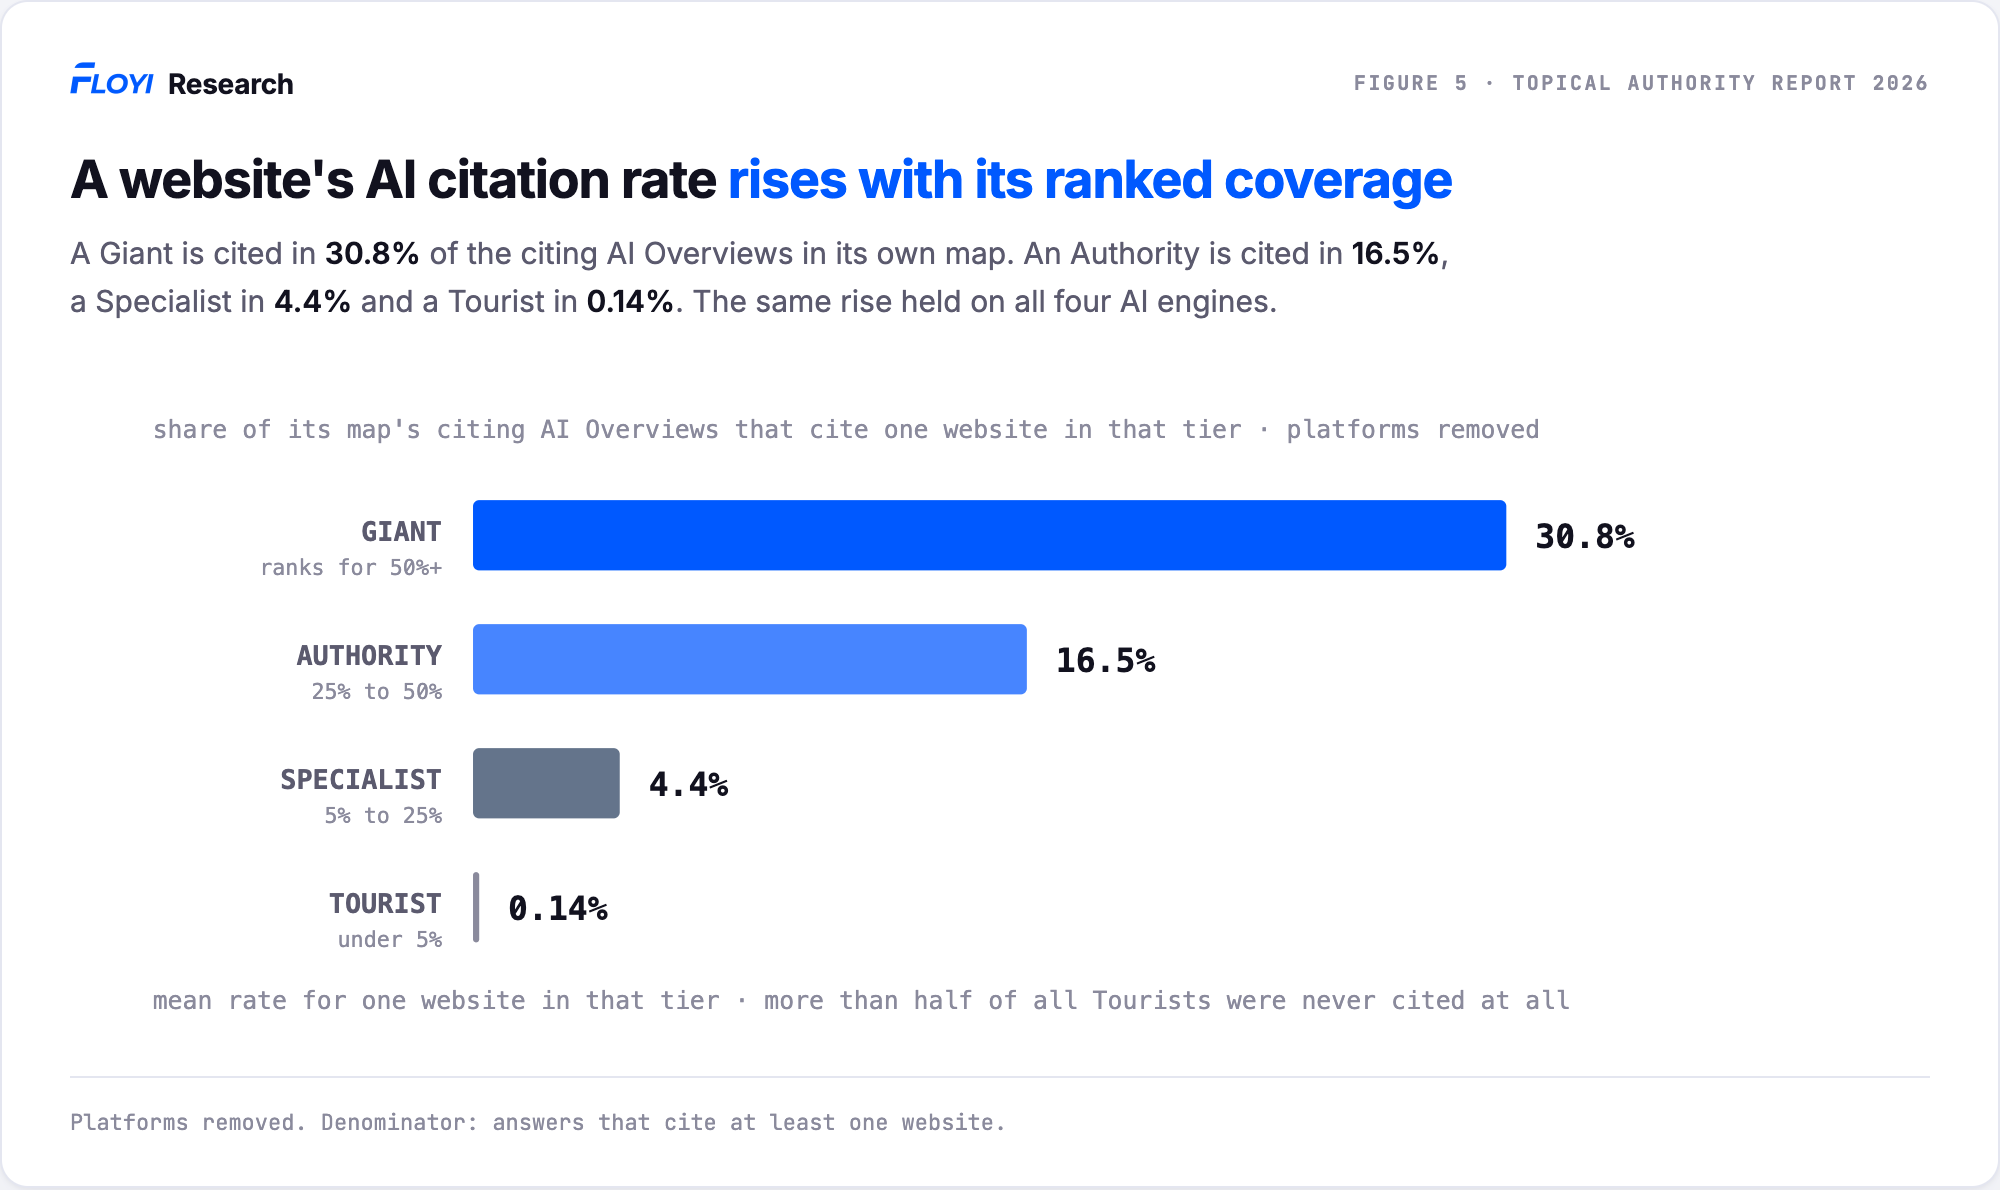
Figure 5. Citation rates rise with ranked coverage.
The table below removes the 20 platform websites so that the results aren’t driven by YouTube, Reddit and similar cross-topic sources. That leaves the Giant column resting on 13 non-platform websites across 9 maps, so read it as directional.
| AI engine | Giant | Authority | Specialist | Tourist |
|---|---|---|---|---|
| AI Overviews | 30.8% (29.1%) | 16.5% (16.7%) | 4.4% (3.3%) | 0.14% (0.0%) |
| AI Mode | 24.7% (28.7%) | 16.3% (17.0%) | 3.8% (2.4%) | 0.12% (0.0%) |
| ChatGPT | 11.6% (10.3%) | 7.9% (4.9%) | 2.9% (0.7%) | 0.05% (0.0%) |
| Gemini | 13.0% (12.2%) | 6.9% (7.3%) | 2.2% (1.5%) | 0.10% (0.0%) |
Each cell is the mean (median) share of citing answers that cited an individual website in that tier. More than half of Tourists were never cited, which is why every Tourist median is zero.
We ran three checks on this relationship. Removing the platform group barely moved it, so it isn’t just a YouTube, Reddit or Wikipedia effect. Removing the Tourist tier, which is most of the websites in a map, made it stronger on the Google engines and left it positive on all four. Moving every tier boundary up and down kept the citation-rate order intact in 11 of 12 tests. Full results are in Appendix A below.
The relationship held in every cut we tried. What it doesn’t tell you is where the citations actually land.
A high citation rate per website doesn’t mean the top tiers receive most of the available citation slots. Tourists take 55.3% of AI Overview citations, and the largest share on three of the four engines, because a map holds about 3,000 of them.
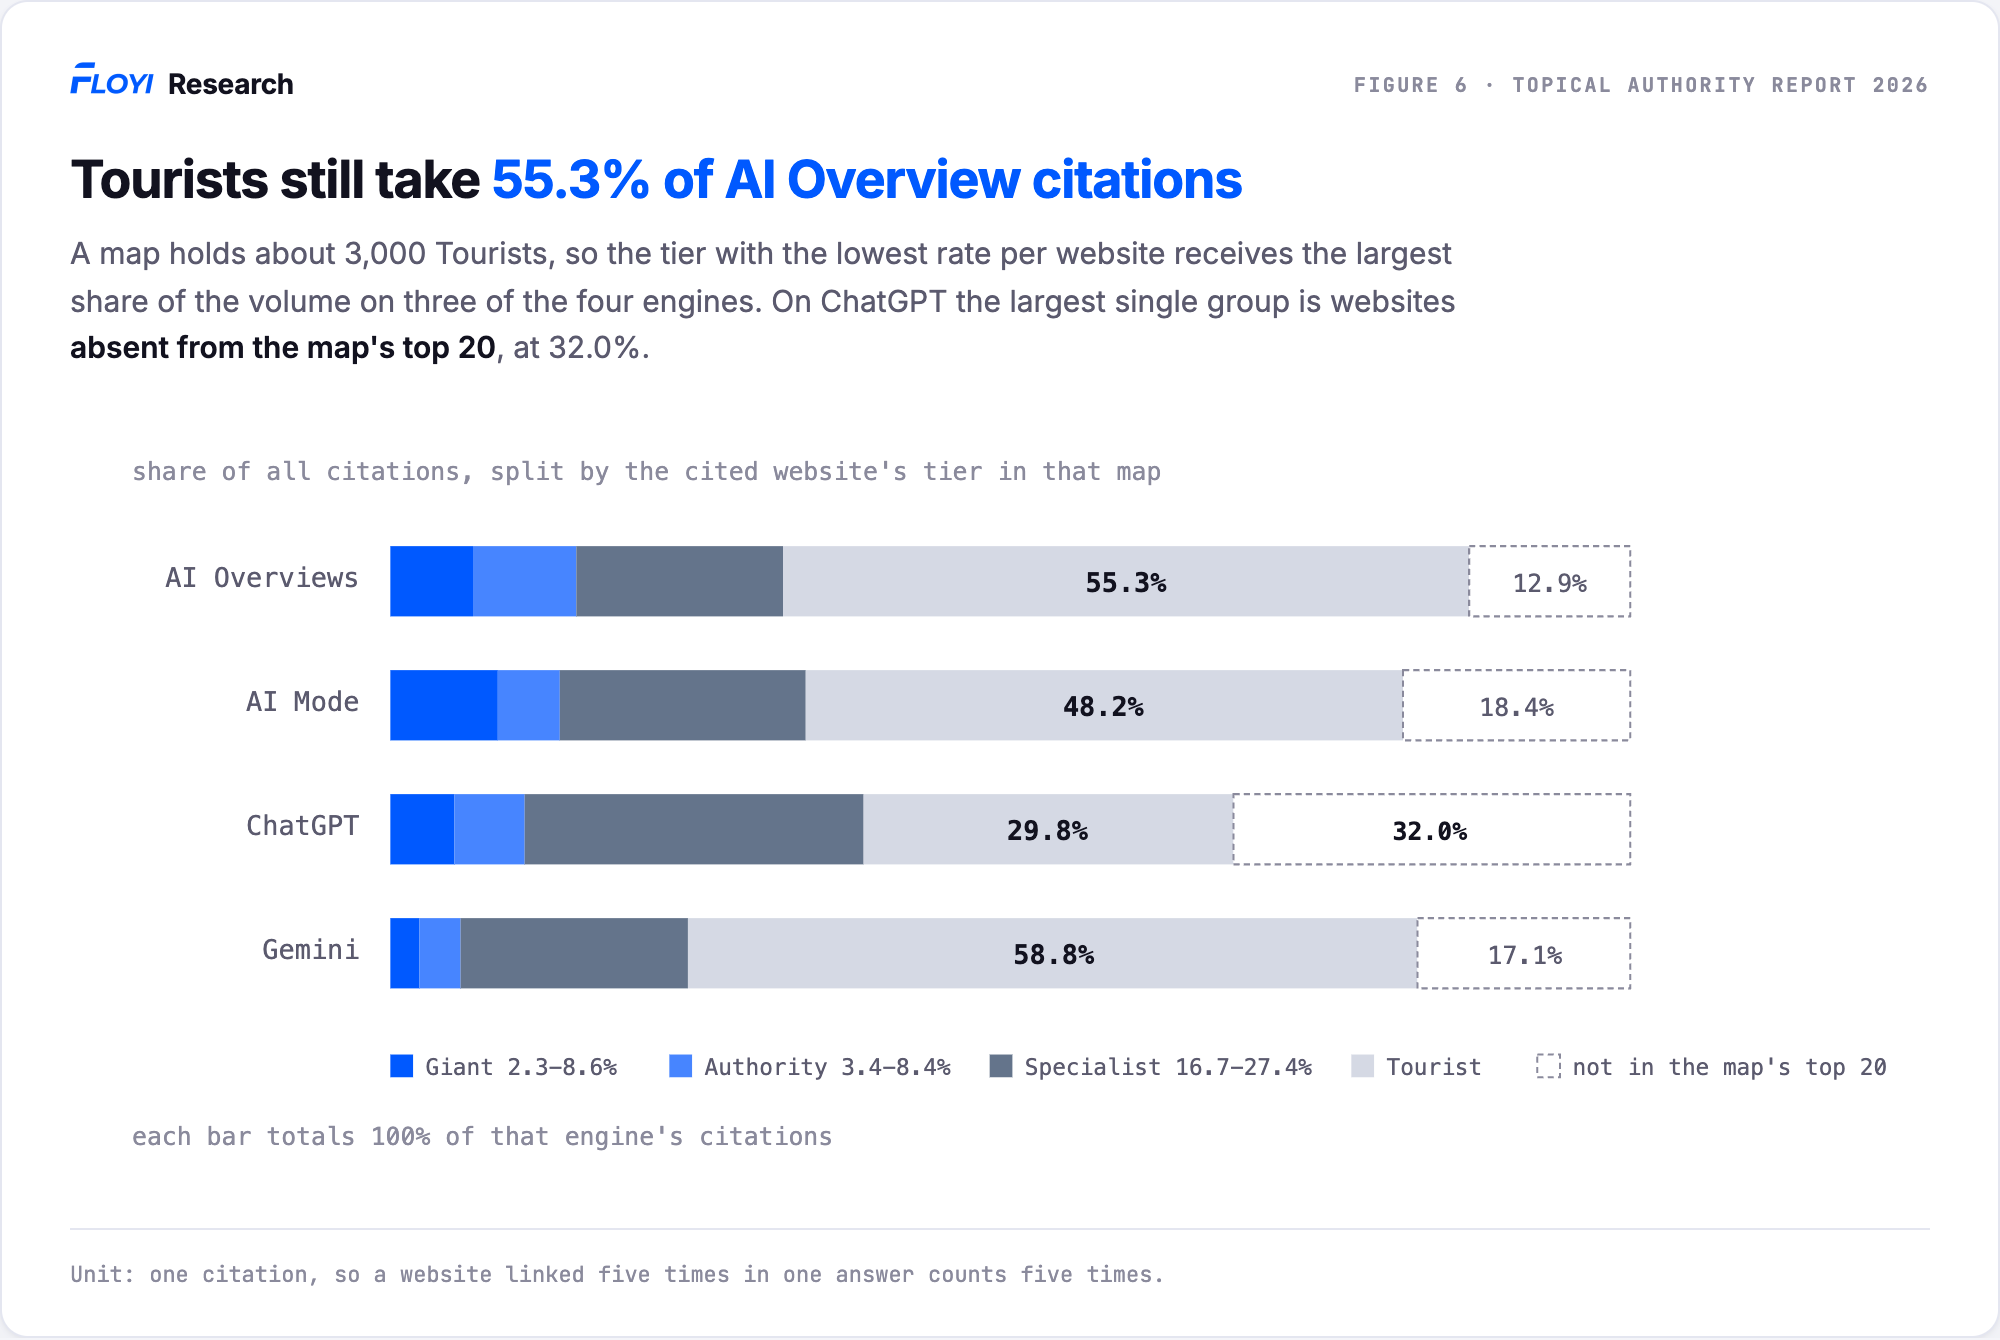
Figure 6. Where citations go by ranked-coverage tier.
Individually, each of them is rarely cited though. The average Tourist is cited in 0.14% of its map’s citing answers, and that barely moves whether platforms are in or out.
The same relationship turns into a near-certainty at the top. Sort every website an AI Overview cited by how many citations it collected, and the heavily cited ones are almost all websites that rank somewhere in that map.
| Cited how many times | Websites | Ranks in its own map | Ranks nowhere in it | Share ranking in it |
|---|---|---|---|---|
| Once | 53,462 | 28,558 | 24,904 | 53% |
| 2 to 4 times | 18,077 | 15,466 | 2,611 | 86% |
| 5 to 9 times | 4,435 | 4,320 | 115 | 97% |
| 10 to 24 times | 2,229 | 2,197 | 32 | 99% |
| 25 or more | 1,157 | 1,149 | 8 | 99% |
Half the websites cited exactly once rank nowhere in the map, so one citation says little on its own. Of the 1,157 cited 25 times or more, all but 8 rank somewhere in that map. This says they hold a top-20 position for at least one of its topics, not that they rank for most of them.
For AI Overviews, the same rise in citation rate from Specialist to Authority to Giant also appeared in all six industry groups. The average Health and Wellness Giant is cited in 54.0% of its map’s citing answers, against 19.5% for E-commerce and DTC.
Figure 7. AI Overview behavior by industry.
| Category | Queries with an AI Overview | Platform share | Giant cited on | Authority | Specialist |
|---|---|---|---|---|---|
| Health & Wellness | 98.4% | 19.8% | 54.0% | 20.1% | 5.7% |
| B2B & SaaS | 88.9% | 14.6% | 41.6% | 22.7% | 4.8% |
| Travel & Experiences | 88.0% | 21.0% | 36.9% | 19.7% | 4.9% |
| Media & Affiliate | 86.8% | 20.3% | 35.8% | 12.9% | 4.1% |
| Local & Regional Services | 84.7% | 15.2% | 38.5% | 21.6% | 4.8% |
| E-commerce & DTC | 64.0% | 17.3% | 19.5% | 10.0% | 2.4% |
These tier columns keep the platform group in, so they run above Figure 5, which removes it.
As with the organic structure in Section 1, this table shows the pattern recurring in each category rather than ranking them against each other. Read the rows as six separate confirmations of the same pattern.
54% of ChatGPT answers and 61% of Gemini answers cite no websites, compared with just 3% of Google AI Overviews.
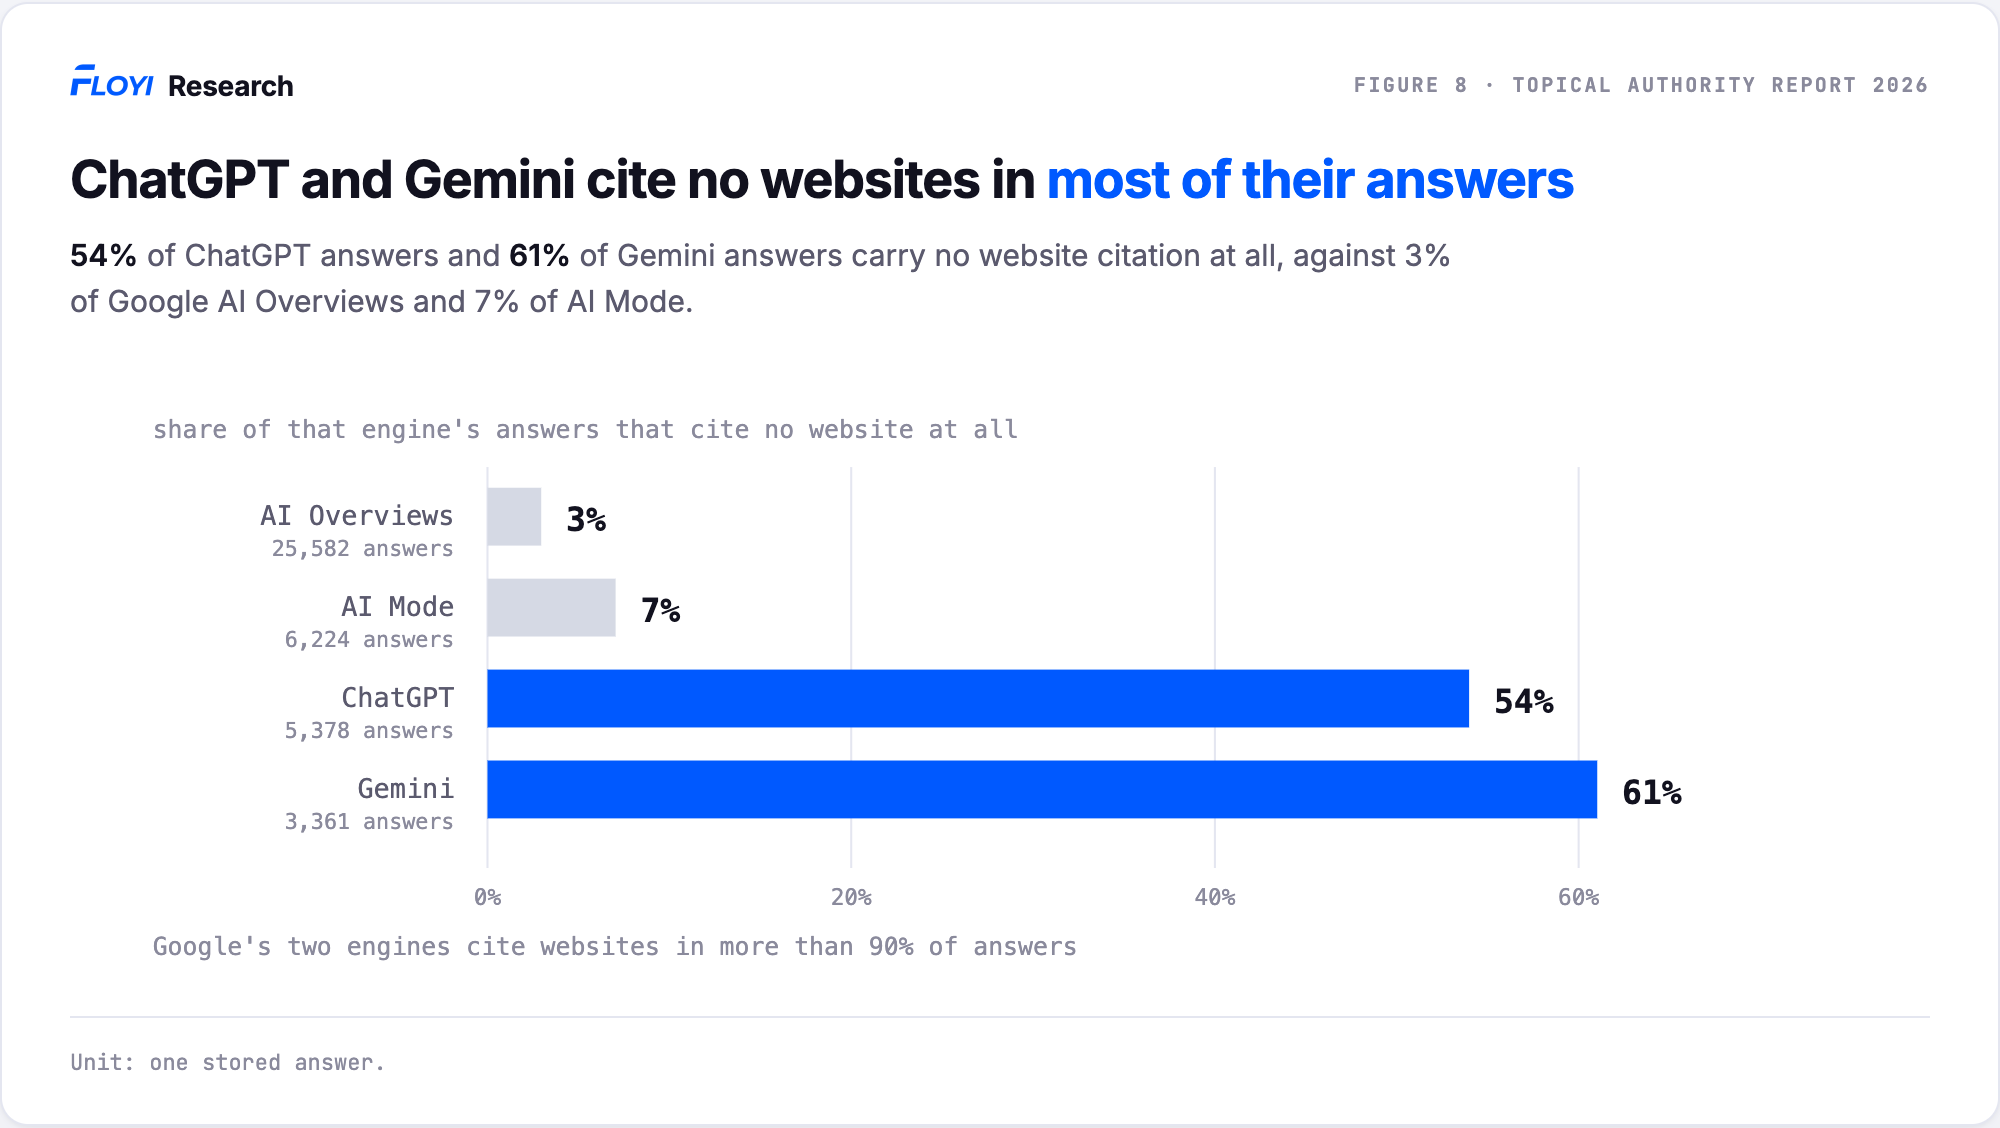
Figure 8. Share of answers with no website citations.
Every rate in this report states whether citation-free answers are included.
On ChatGPT and Gemini that leaves the citation measure silent for most answers. Websites are still named in those answers without being linked, and that naming follows ranked coverage too. That naming is weaker evidence than the citation work and rests on a narrower set of websites, since only those with real coverage in a map were scanned rather than the thousands that rank for a topic or two, so this report does not build on it.
The rankings and the AI answers both came out of Floyi’s Topical Authority tracking, which records Google search results and all four AI engines against the same map. Because both run against the same query set, a ranking and a citation can be matched to the same topic.
So far every result has counted citations across a whole map. That leaves the more specific question untouched: when an AI answers one query, where do the websites it cites rank for that query?
3. 40.2% of AI Overview Citations Come From Outside That Query’s Top 20
When a website appeared in the exact query’s top 20, a better organic position was associated with a higher citation rate. Ranking in positions 1 to 3 for a topic, that topic’s AI Overview cites it 60.7% of the time. The rate falls to 38.6% at positions 4 to 10 and 12.9% at positions 11 to 20.
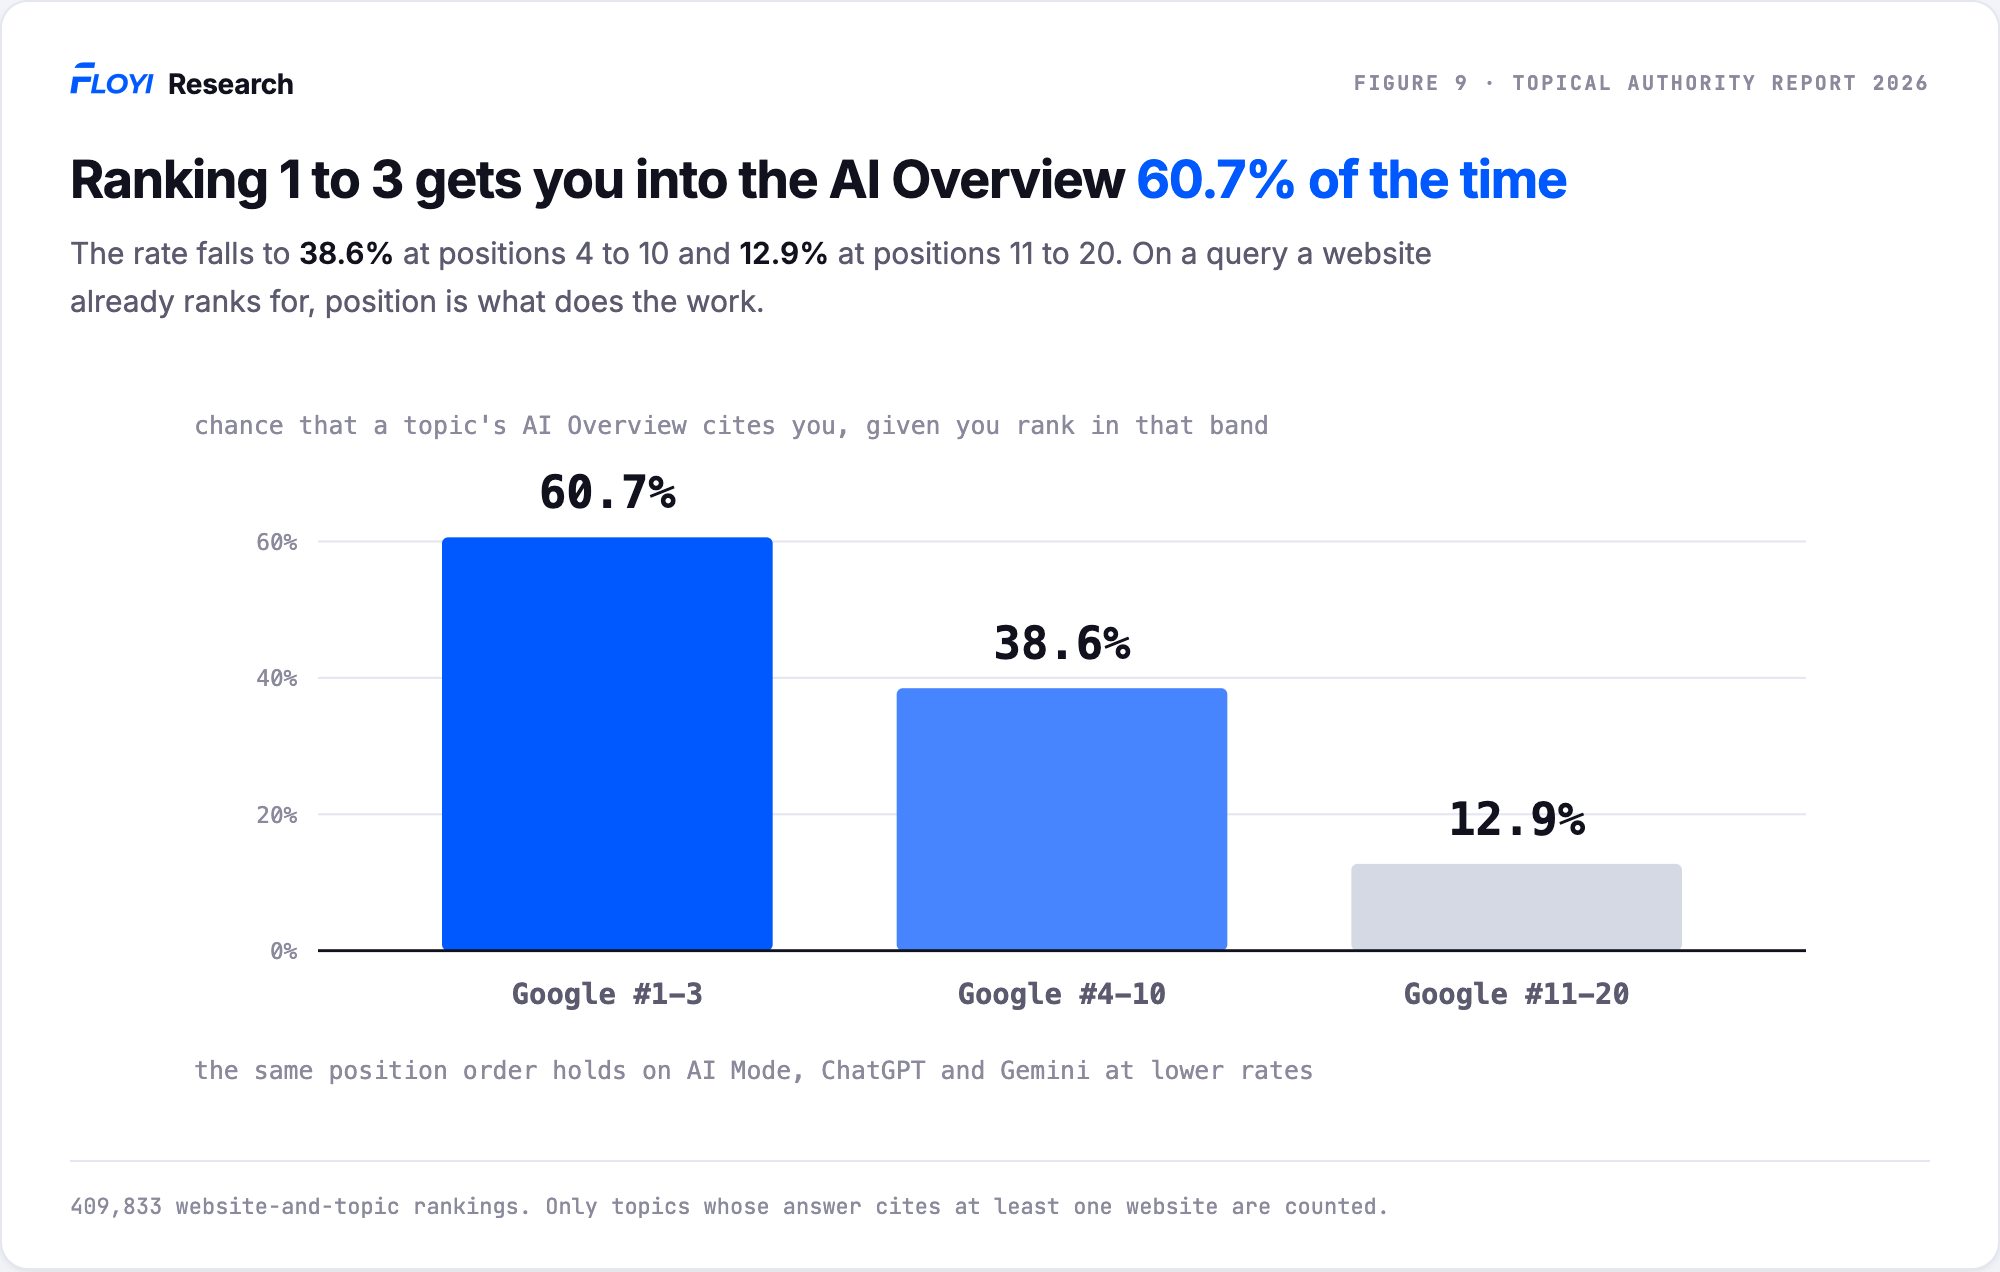
Figure 9. AI citation rate by Google position.
| AI engine | Positions 1 to 3 | Positions 4 to 10 | Positions 11 to 20 |
|---|---|---|---|
| AI Overviews | 60.7% | 38.6% | 12.9% |
| AI Mode | 44.7% | 23.2% | 12.6% |
| ChatGPT | 17.7% | 7.3% | 3.6% |
| Gemini | 28.7% | 17.0% | 7.8% |
Each cell is the share of times a website ranking in that position range was also cited in that topic’s AI answer. Only topics whose answer cites at least one website are counted. The position order remains the same if citation-free answers are included, although the rates become lower.
So position decides a lot, but only among the websites already in the top 20. Many cited websites aren’t there at all. 40.2% of AI Overview citations involve a website outside the exact query’s top 20, and the share rises to 71.9% for ChatGPT.
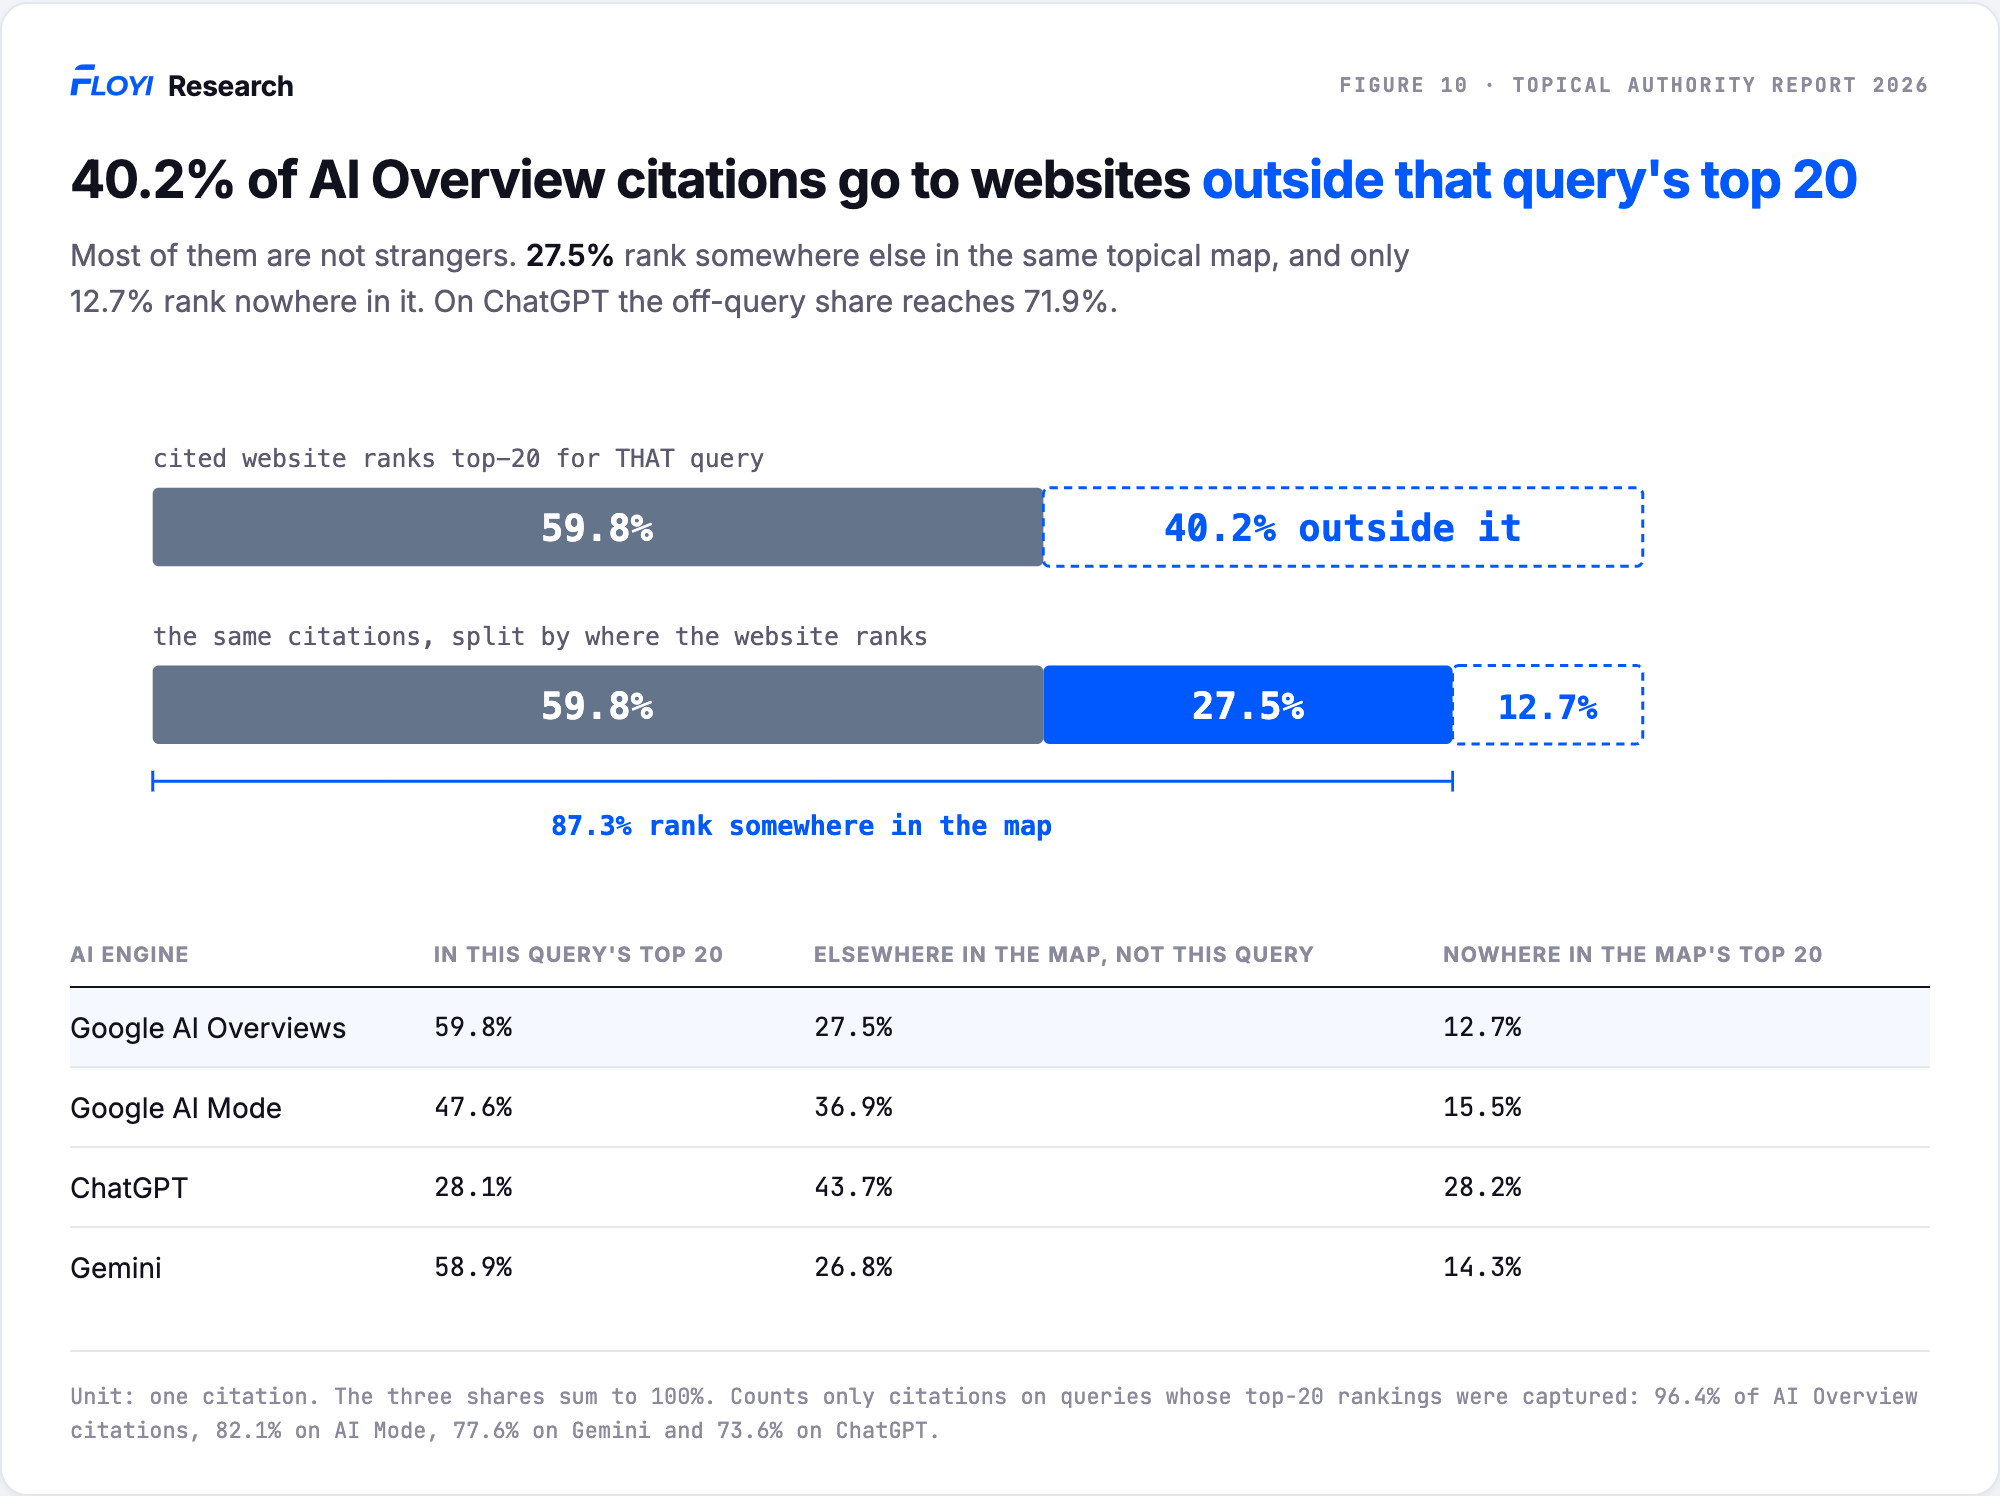
Figure 10. Exact-query and same-topic overlap.
Every citation falls into one of three groups. The cited website ranked in the top 20 for that exact query, or it ranked somewhere else in the same map but not for that query, or it ranked nowhere in the map at all. The figure gives the split for each engine.
The unit is one citation, so an AI answer linking to five different URLs from the same website counts five times. The three shares sum to ~100%.
Take the exact-query share away from 100% and you get how often a cited website was missing from that query’s top 20.
- AI Overviews 40.2%
- AI Mode 52.4%
- ChatGPT 71.9%
- Gemini 41.1%
These percentages don’t mean those websites had no Google ranking. They mean the website wasn’t ranking in the top 20 for the exact query. The website could be ranking from page three on or not ranking at all.
The middle group is the one this section turns on. Call it an off-query citation: the website isn’t ranking in the query’s top 20, but ranks somewhere else in the same map. On AI Overviews, 27.5% of citations are off-query. Across the four engines the share runs from 26.8% to 43.7%.
Who Gets Cited on a Query They Do Not Rank For
So off-query citations are 26.8% to 43.7% of the total. The question is who collects them. We tested it two ways: first by ranking the websites, then by sorting them into the four coverage tiers.
The first test. For each website in a map, count the off-query citations it collected, then check whether the websites covering more of that map are the same ones at the top of that count.
| AI engine | How closely the two line up |
|---|---|
| AI Overviews | 0.37 |
| AI Mode | 0.30 |
| ChatGPT | 0.18 |
| Gemini | 0.23 |
They are. Every map we calculated came out positive, on all four engines, with the platform sites excluded. A website that covers more of its map gets cited more often on the queries it doesn’t rank for.
ChatGPT is the only engine here that Google doesn’t build, and it’s the weakest of the four. The medians, the confidence intervals and the same test with Tourists removed are in Appendix A.
The second test. Drop the ranking and use the four coverage tiers instead. Across all websites, the off-query AI Overview citation rate is 22.72% for Giants and 0.03% for Tourists. Almost all of that Giant figure is platforms, which the table below separates out.
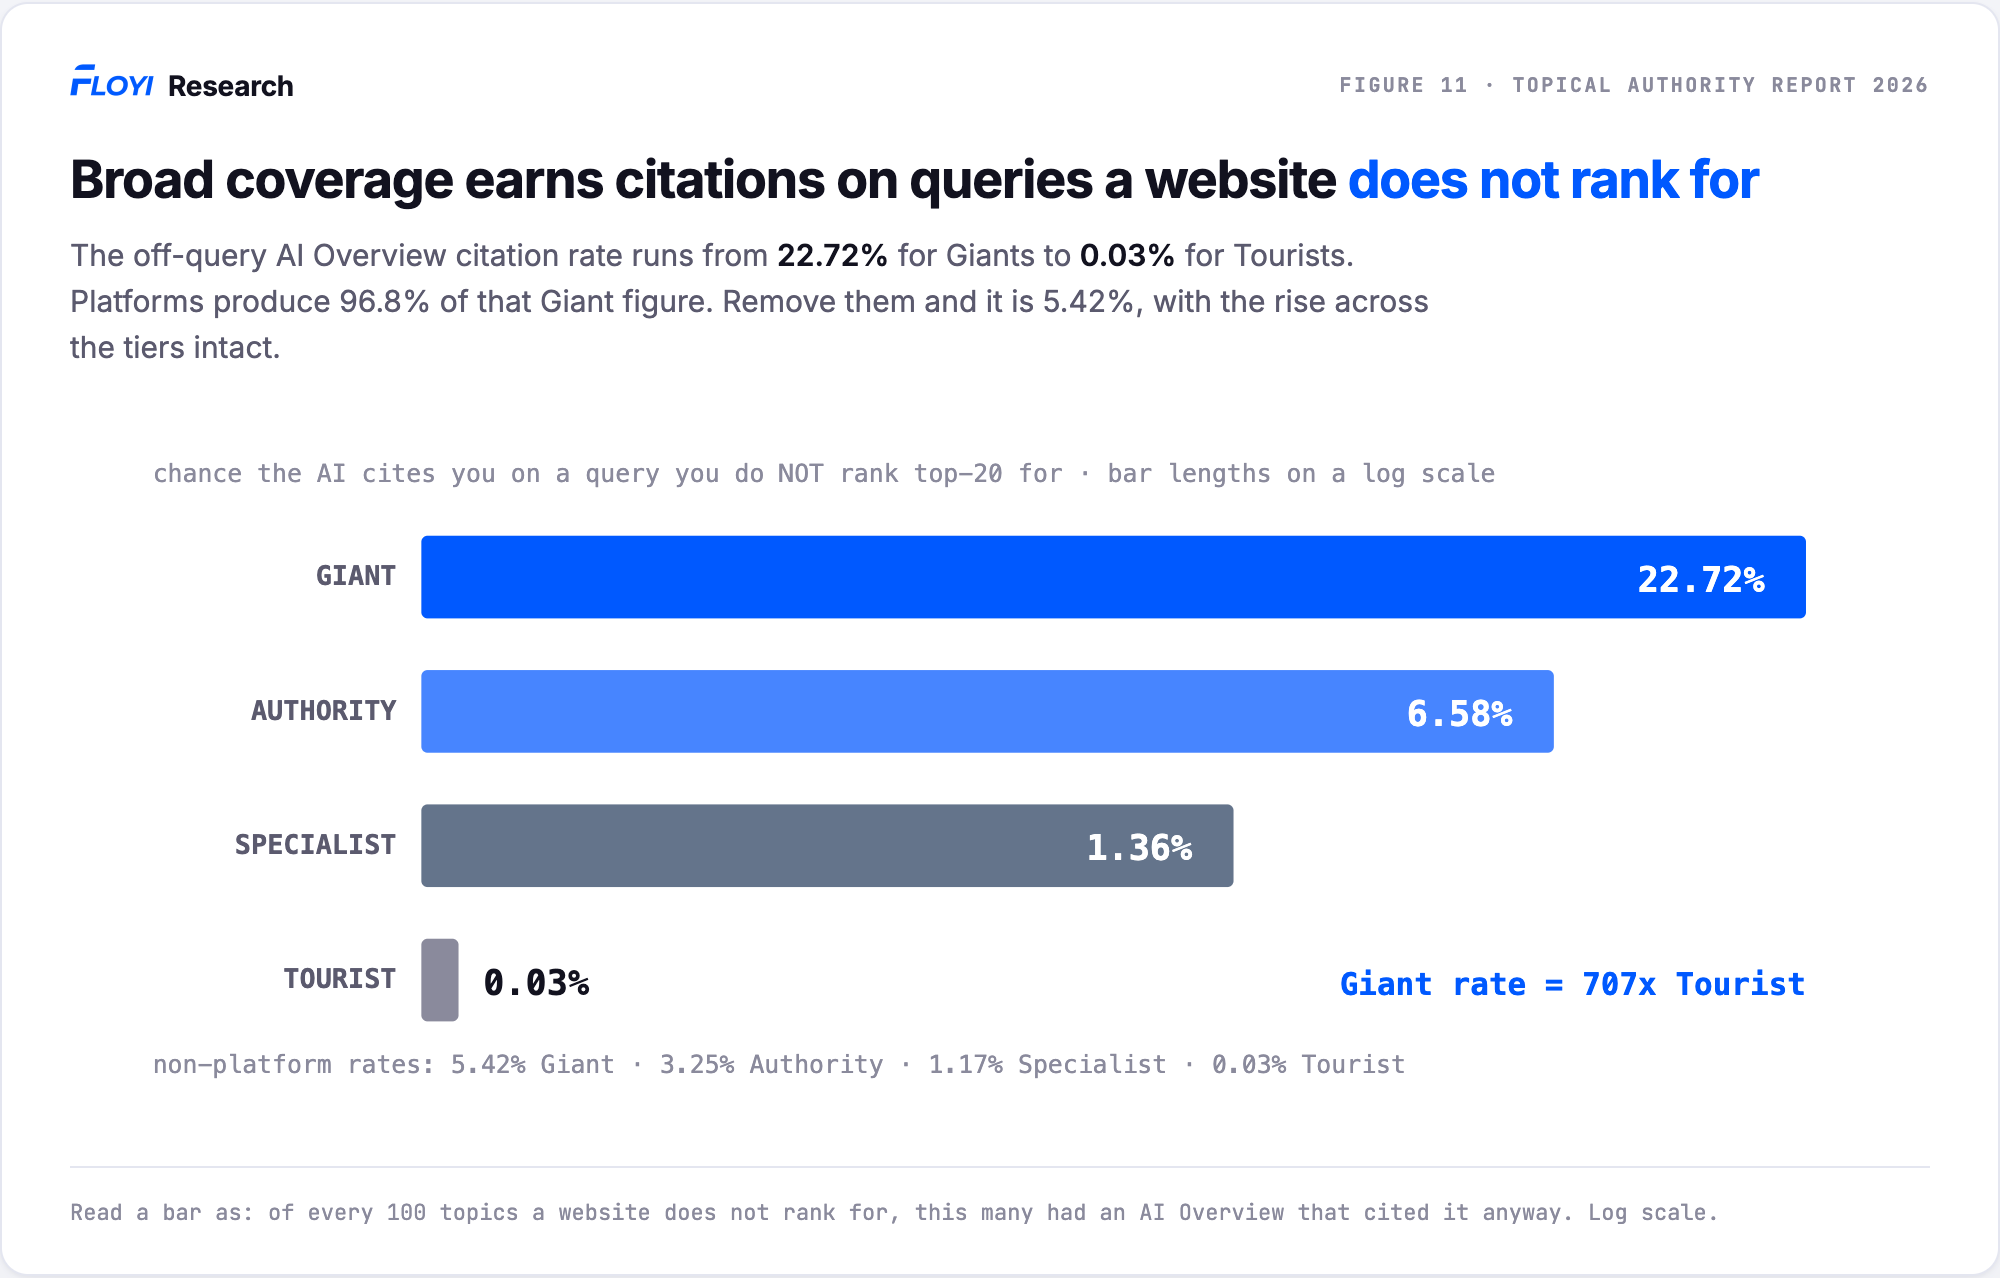
Figure 11. Off-query AI Overview citation rate by ranked-coverage tier.
| AI engine | Giant | Authority | Specialist | Tourist |
|---|---|---|---|---|
| AI Overviews | 22.72% | 6.58% | 1.36% | 0.03% |
| AI Mode | 15.25% | 7.02% | 2.41% | 0.06% |
| ChatGPT | 5.67% | 5.23% | 2.50% | 0.04% |
| Gemini | 6.06% | 1.56% | 0.83% | 0.04% |
Read a Giant’s 22.72% like this. Take one Giant and list every topic in its map where it does not rank in the top 20. Out of every 100 of those topics, the AI Overview cited it anyway on about 23. Run the same count for a Tourist and it’s 3 topics in every 10,000.
It doesn’t mean 22.72% of topics returned an AI Overview, and it isn’t a share of the map. Each tier has its own separate count of missed topics, which is why the four numbers in a row don’t add up to anything.
The platform group produces 96.8% of AI Overview off-query Giant citations. Remove it and the rates drop sharply at the top.
- Giant 5.42%, down from 22.72%
- Authority 3.25%
- Specialist 1.17%
- Tourist 0.03%
The four tiers still fall in the same order, but the 22.72% Giant figure is mostly platforms.
Once platforms are removed the tier numbers get shaky on the other three engines. AI Mode’s four tiers stop falling in order, and the ChatGPT and Gemini maps here have no non-platform Giants at all. The first test is the more reliable of the two, because it uses every website rather than four small groups, and it came out positive on all four engines.
Why off-query citations happen is a question this study can’t directly answer, but fan-out queries could be a reason.
AI Overviews and AI Mode don’t always answer the query as typed. They break it into related sub-queries, run those, and build a synthesized answer from the results. A website cited for a query it doesn’t rank for might be ranking for one of those sub-queries instead.
We have no evidence for it. We can record the query sent to the AI engines, but their sub-queries’ results aren’t obtainable. We don’t know what websites the query received from a fan-out query response.
Position Beats Coverage on a Query You Already Rank For
When a website already ranked for a topic, the higher-ranking websites were cited more often in that topic’s AI answer. How much of the rest of the map the website covered did not add a clear advantage within the same position range.
| AI engine | Google position | Giant | Authority | Specialist | Tourist |
|---|---|---|---|---|---|
| AI Overviews | 1 to 3 | 70.4% | 55.5% | 63.7% | 59.8% |
| AI Overviews | 4 to 10 | 31.8% | 31.6% | 41.2% | 37.9% |
| AI Overviews | 11 to 20 | 13.5% | 14.4% | 13.6% | 11.4% |
| AI Mode | 1 to 3 | 20.0% | 43.1% | 52.2% | 41.8% |
| AI Mode | 4 to 10 | 9.3% | 23.1% | 29.3% | 21.7% |
| AI Mode | 11 to 20 | 7.8% | 3.7% | 17.3% | 11.2% |
| ChatGPT | 1 to 3 | none | 18.9% | 24.4% | 11.0% |
| ChatGPT | 4 to 10 | none | 8.3% | 12.7% | 4.3% |
| ChatGPT | 11 to 20 | none | 11.8% | 8.5% | 2.1% |
| Gemini | 1 to 3 | none | 25.5% | 30.0% | 30.3% |
| Gemini | 4 to 10 | none | 17.2% | 20.3% | 17.7% |
| Gemini | 11 to 20 | none | 23.1% | 10.5% | 7.8% |
Each cell counts rankings, not websites. Take the 70.4% for Giants on AI Overviews. A Giant held a top-three position for a topic 672 times across the 42 maps, and on 473 of those times the AI Overview cited it. 473 out of 672 is the 70.4%.
So on a query you already rank for, your position decides whether the answer cites you, and your coverage of the map adds nothing on top of it. The same thing happens on all four AI engines. Looking across each row, the four tiers don’t line up in coverage order with the percentages.
Take the AI Overviews row for positions 1 to 3. Authorities were cited least of the four tiers, at 55.5%, below Tourists at 59.8%. An Authority ranks for a quarter to a half of its map and a Tourist for under 5%, yet holding the same three positions put them four points apart, with the Tourist ahead. Gemini’s most cited tier in the top three positions is also Tourists. On AI Mode it’s Specialists, and Giants come last.
That does not contradict what was said earlier in Section 2 about the positive correlation of a higher ranked coverage with more AI citations. Coverage still goes with more citations overall, it just doesn’t get there by making you a better bet on any single query. What it does is put you in the top 20 for far more queries, so the same odds are applied many more times.
One note: platforms are removed here. AI Overviews has 9 Giants and 72 Authorities. AI Mode has 2 Giants and 8 Authorities. ChatGPT has no Giants and 2 Authorities, Gemini no Giants and 3 Authorities, which is why those cells are blank.
What This Section Establishes
After platforms are removed, mean website citations per website rise from 1 for Tourists to 89 for Giants. Divide each tier’s citations by the queries its websites rank for and the four sit much closer together, at 0.42, 0.31, 0.39 and 0.39. That second measure includes citations from both ranked and off-query answers, so it is not a conversion rate.
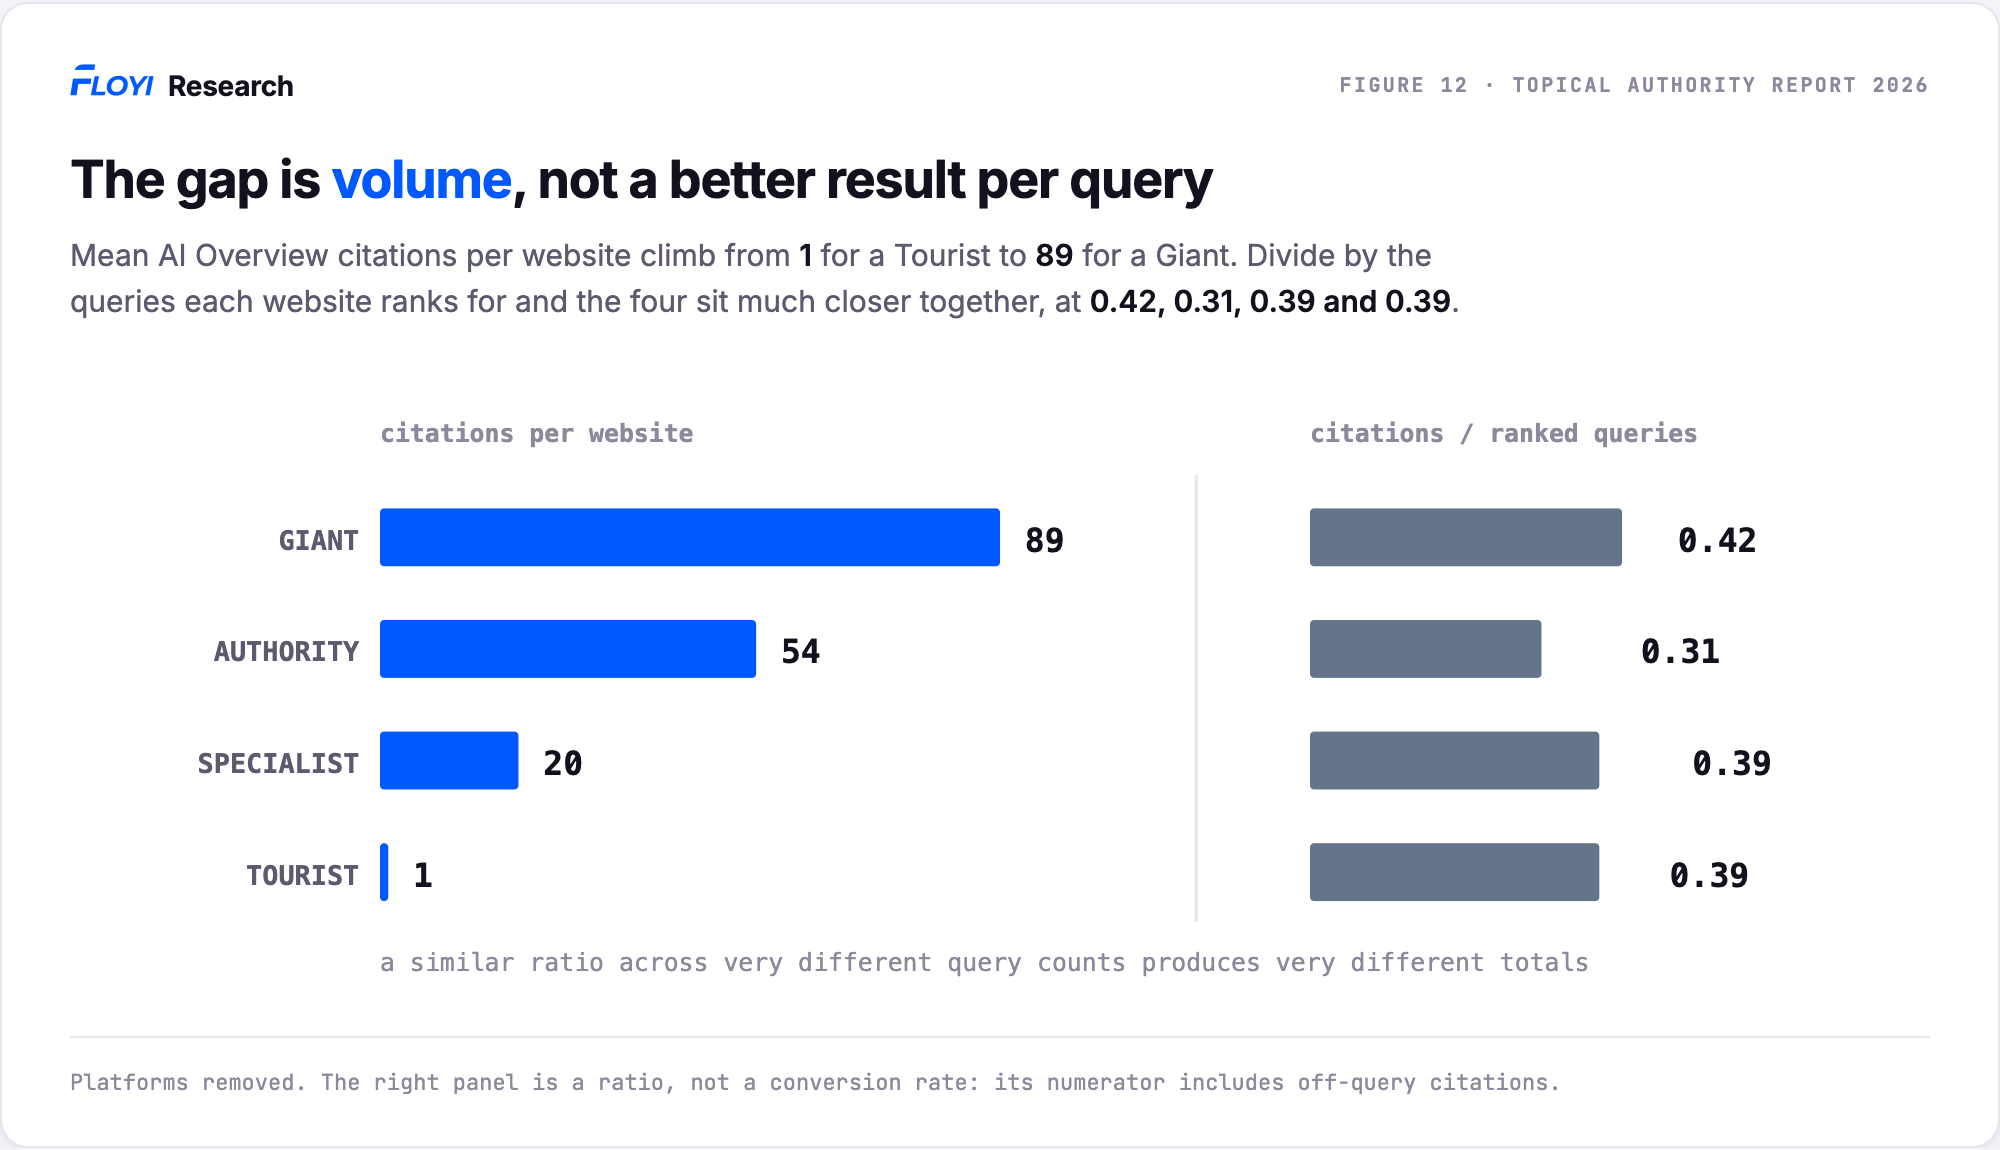
Figure 12. AI Overview website citations per website and per ranked query.
Four statements come out of this section, and they’re easy to confuse with each other.
| What we tested | Result |
|---|---|
| Does a better Google position on a query tie to more AI citations for it? | Yes, strongly, on all four AI engines |
| Does ranking for more of a map’s topics tie to more AI citations overall? | Yes, on all four AI engines |
| Does more coverage improve the odds on a query the website already ranks for? | No |
| Does more coverage improve the odds on a query the website does not rank for? | Yes, on all four AI engines |
The last two rows aren’t in conflict. On a query a website already ranks for, its position does the work and coverage adds nothing measurable on top. On a query it doesn’t rank for, there’s no position to do that work, and coverage is what separates the websites that still get cited from the ones that don’t.
The second row is then a matter of volume. A website in the top tier was cited in 30.8% of its own map’s citing AI Overviews, against 0.14% for a website in the bottom tier.
That gap comes from how many queries each website ranks for, not from a better result on any one of them. Work it through with the two ends of the table.
A Giant collects 89 citations and a Tourist collects 1, so the Giant gets 89 times more citations. A Giant ranks for 211 of its map’s queries and a Tourist for 2.6, so the Giant also gets 81 times more chances at one.
Those two multipliers are nearly the same size. Getting 89 times the citations out of 81 times the chances works out to about 10% better per chance, not 89 times better. Almost all of the Giant’s advantage is the extra chances, not what it does with them.
Dividing makes it exact. 89 citations over 211 ranked queries is 0.42 citations for every query the Giant ranks for. 1 citation over 2.6 ranked queries is 0.39. Authorities come in at 0.31 and Specialists at 0.39. The 89-to-1 gap in the left panel becomes a gap between 0.31 and 0.42.
So a Giant is not doing better on any single query it ranks for. It is doing about the same thing, many more times. That is a ratio, not a conversion rate, because the citations in it include off-query answers.
That leaves one comparison. Ranked coverage tracks AI citations, but so might any measure of a website’s general strength. The last section tests it against the one the industry reaches for first.
4. Ranked Coverage Beat Domain Rating on All Four AI Engines
Inside a map, ranked coverage correlates with AI Overview citations at 0.51. Domain Rating (DR), measured on the same websites, manages 0.09.
Ranked coverage and Domain Rating have a mean within-map correlation of 0.11, so the two barely move together. This makes sense because DR is related to backlinks and not rankings.
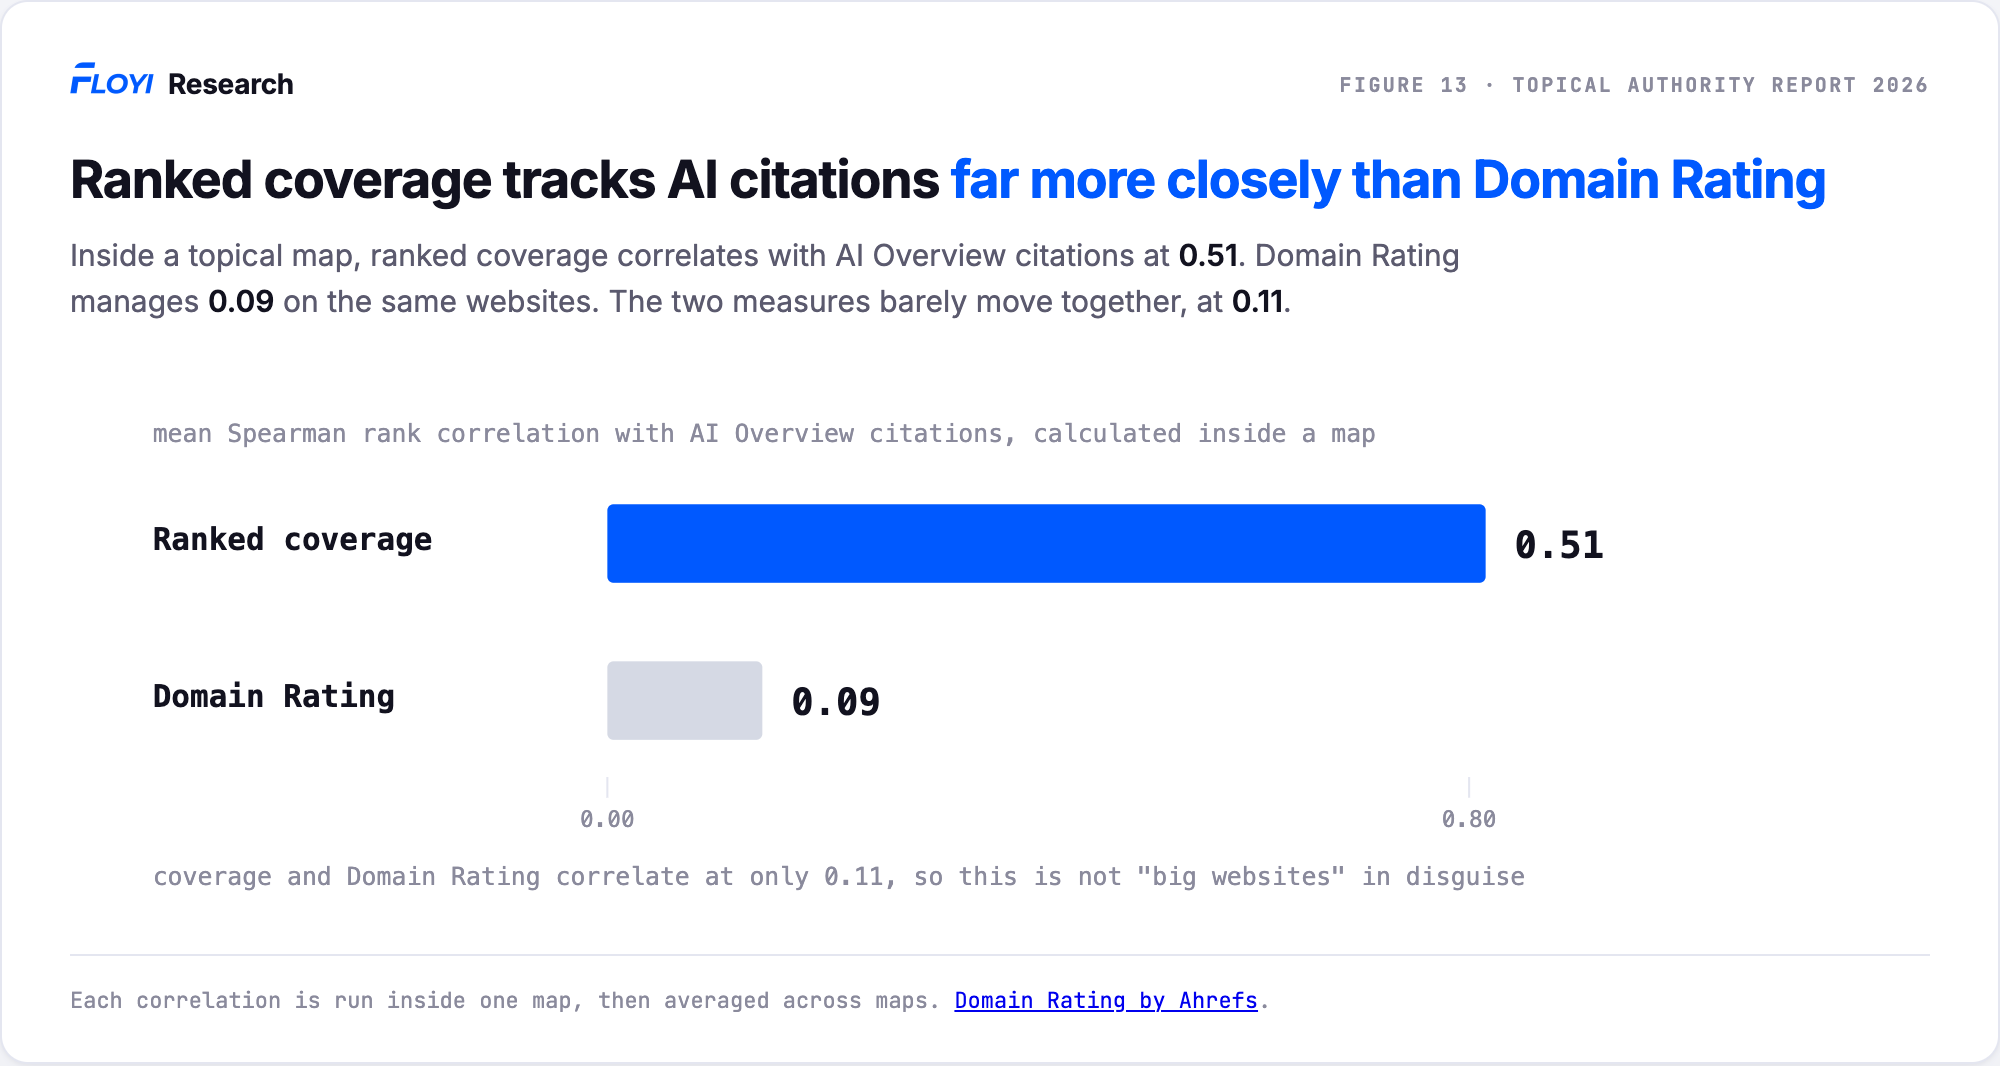
Figure 13. Correlation with AI Overview citations.
We ran the same comparison on every AI engine. Ranked coverage was the stronger of the two on all four engines.
| AI engine | Ranked coverage, mean (median) | Domain Rating, mean (median) |
|---|---|---|
| AI Overviews | 0.51 (0.52) | 0.09 (0.09) |
| AI Mode | 0.48 (0.46) | 0.16 (0.17) |
| ChatGPT | 0.33 (0.30) | 0.15 (0.16) |
| Gemini | 0.36 (0.43) | 0.11 (0.11) |
The unit is one website in one map, and both columns use the same websites, so the two measures are compared on identical ground.
Domain Rating tracked citations a little more closely on AI Mode and ChatGPT than on AI Overviews, but ranked coverage was ahead on every engine. The gap is widest on AI Overviews. However, that doesn’t make ranked coverage a replacement for links, and this study doesn’t establish it as a cause of AI citations.
DR is just as weak at identifying coverage itself. It does rise as coverage rises, but the ranges overlap so heavily that a website’s DR can’t tell you which tier it sits in.
- 6 of the 45 Giant placements have a DR below 60
- Nearly 25% of Authority placements are below 60 as well
- 7.9% of Tourist placements carry a DR of 90 or higher, and a Tourist ranks for under 5% of its map
A strong backlink profile does not tell you how broadly a website ranks in a topic.
The comparison does not hold content quality, brand familiarity or any other factor constant. The two measures are also captured differently in time. Domain Rating is a single snapshot, while the rankings and citations were collected across a window, so a website’s DR here isn’t necessarily the DR it had when a given citation was collected.
What This Means for SEO and AI Search
- Measure visibility across a defined topical scope, not only one keyword at a time. This study quantifies the distinction: 26.8% to 43.7% of citations came from websites ranking elsewhere in the same topical map, but not in the exact query’s top 20.
- Track one query per topic, not every keyword variant. Ten keywords that mean the same thing return nearly the same results, so any website ranking on that cluster gets counted ten times for what is really one topic. Its coverage looks ten times broader than it is, the map looks ten times bigger than it is, and every comparison between websites tilts toward whoever happens to sit on the over-represented clusters. This study tracked one head term per topic for exactly that reason.
- Keep exact-query rankings and ranked coverage as separate metrics. Higher positions are associated with more citations when a website ranks for the query, while wider coverage describes a different source of visibility.
- Do not use Domain Rating as a substitute for topical visibility. DR and ranked coverage measure different things, and ranked coverage had the stronger citation relationship in this dataset.
- Use the tiers as benchmarks, not a guaranteed progression. This snapshot does not show websites moving from Tourist to Specialist to Authority to Giant.
- Build the topical map before you measure anything. Every number in this study divides by the map, so the map is the measurement. A coverage percentage only means something if the denominator is a real set of distinct topics that covers the subject and audience the brand wants to reach. Get there by clustering keywords into topics first, one page and one head term per topic. Skip that and you aren’t measuring coverage of a subject, you’re measuring coverage of a keyword list, and a keyword list with a hundred overlapping terms will hand the same few websites the same score over and over again.
What This Says About Topical Authority
This report opened by saying topical authority is one of the most repeated ideas in SEO and one of the least measured, so we measured something narrower and observable instead: ranked coverage, the share of a map’s topics where a website holds a top-20 Google position.
On that measure, breadth and depth behave the way the idea predicts.
- Websites covering more of a topical map were cited more often by all four AI engines
- They kept getting cited on queries they didn’t rank for, which is where coverage does its clearest work
- They did it more consistently than Domain Rating anticipated, a metric built on links rather than subject breadth
What breadth did not do was make a website a better answer to any one query. On a query you already rank for, your position decides it. Coverage earns its citations by putting you in contention across far more of the subject, not by winning any single contest more often.
None of that proves an AI engine is scoring topical authority. But it does show that covering a subject broadly and deeply are measurable against a defined map, and that what it measures moves together with how often AI answers cite you.
Measuring your own ranked coverage starts with the map, and a map is only as good as what it is built on. In Floyi that sequence runs brand foundation first, then audience research to establish who the topics have to serve, and then a topical map that gives every coverage percentage a denominator worth measuring against.
Methodology
Where the data comes from. Every number here is aggregated and anonymized from 42 topical maps created in Floyi. No customer is identified or identifiable. These are curated maps built for real brands, not a random sample of the web, and the results describe those maps rather than Google or any AI engine as a whole. Collection ran to a cutoff of August 17, 2026, so nothing after that date is in the study.
What we captured from Google. Rank tracking recorded page one and page two of Google’s results for every query in every map, which is what “top 20” means throughout. A Google page doesn’t always carry ten organic results, so a query returned 18.3 of them on average. A website missing from that window may still rank below it, which is why the report never says a missing website doesn’t rank.
What we captured from the AI engines. Each map’s queries were sent to the four engines as prompts, and the answers were stored with the URLs they cited. Rankings and answers therefore run against the same query set, which is what lets a ranking and a citation be matched to the same topic.
How the numbers were calculated. Almost every result is worked out inside one map first, then averaged across the 42. Map sizes vary widely, from 107 to 3,489 queries and from 578 to 12,844 ranking websites. Each map contributes a single number to that average whatever its size, so the map with 12,844 websites counts once and so does the map with 578. Pooling every website into one bucket instead would have let the largest maps set the result on their own. Correlations work the same way: Spearman’s rank coefficient inside each map, then averaged. The exception is rates that pool answers or website-and-topic pairs across maps, and there a larger map does contribute more.
What the study cannot show. These are snapshots, not a time series. Nothing here follows a website as it publishes and gains coverage, so the report describes relationships between measurements taken at one point rather than what causes what.
Limitations
- The study measures ranked coverage, not published content. It can’t tell whether a missing ranking reflects missing content, content below the top 20 or published content that did not rank.
- The top-20 boundary is incomplete. A website marked as missing from the top 20 may rank below that window, and this study can’t tell the two apart. Its own results show the cost: 12.7% to 28.2% of citations went to websites ranking nowhere in the map’s top 20, and an unknown share of those were ranking on page three or beyond.
- The maps are curated. Their scope, balance and possible near-duplicate queries were not independently audited, and the results should not be treated as web-wide averages.
- The data is a set of snapshots. The study can’t show that publishing more caused broader rankings or that broader rankings caused more AI citations.
- The platform group is an analytical classification. Its members do not share one business model, and two publisher websites are judgment calls.
- The industry split is not a comparison. Every result in this report is calculated across the 42 maps as one dataset. Categories are shown only to demonstrate that the pattern recurs in each of them, and some hold only a handful of maps, so no category should be read as better or worse than another.
Appendix A. Robustness Checks
The Total-Citation Relationship Without Tourists
Because Tourists make up most ranking websites, we repeated the continuous ranked-coverage correlation using only Specialists, Authorities and Giants. The fixed platform group was also removed.
| AI engine | All non-platform websites, mean | Tourists removed, mean (median) | 95% interval for the mean |
|---|---|---|---|
| AI Overviews | 0.50 | 0.61 (0.62) | 0.55 to 0.67 |
| AI Mode | 0.46 | 0.58 (0.66) | 0.47 to 0.68 |
| ChatGPT | 0.32 | 0.34 (0.33) | 0.27 to 0.42 |
| Gemini | 0.36 | 0.37 (0.37) | 0.27 to 0.47 |
The relationship didn’t depend on the large number of Tourists. For AI Overviews and AI Mode, it became stronger after Tourists were removed. ChatGPT and Gemini stayed positive in their citation-rate subsets.
The Off-Query Relationship Across All Four AI Engines
This test uses only the times a website was absent from a topic’s top 20. For each website, it measures how often the website was still cited and correlates that rate with its ranked coverage elsewhere in the map. The fixed platform group is removed.
| AI engine | All non-platform websites, mean (median) | 95% interval for the mean | Specialists and above, mean (median) |
|---|---|---|---|
| AI Overviews | 0.37 (0.39) | 0.34 to 0.40 | 0.44 (0.49) |
| AI Mode | 0.30 (0.31) | 0.21 to 0.38 | 0.33 (0.36) |
| ChatGPT | 0.18 (0.20) | 0.11 to 0.25 | 0.09 (0.23) |
| Gemini | 0.23 (0.30) | 0.11 to 0.35 | 0.25 (0.34) |
The relationship was positive on all four AI engines when all non-platform ranking websites were included. AI Overviews, AI Mode and Gemini are Google products. ChatGPT is the only non-Google engine in the study, and its off-query relationship was positive as well. After Tourists were removed, the ChatGPT and Gemini samples became less stable, which is why those values should remain directional.
Each 95% interval above comes from 10,000 bootstrap resamples of the map-level correlations. The intervals describe uncertainty across the observed maps. They don’t make the curated maps representative of the wider web.
Moving the Tier Boundaries
The continuous correlations above don’t use tiers. As a separate check, we moved every tier boundary lower and higher, then asked whether mean citation rates still followed the order Giant, Authority, Specialist, and Tourist.
| Threshold set | Tourist | Specialist | Authority | Giant | AI Overviews | AI Mode | ChatGPT | Gemini |
|---|---|---|---|---|---|---|---|---|
| Lower | Under 3% | 3% to 20% | 20% to 45% | 45% or more | Same order | Same order | Same order | Same order |
| Published | Under 5% | 5% to 25% | 25% to 50% | 50% or more | Same order | Same order | Same order | Same order |
| Higher | Under 7% | 7% to 30% | 30% to 55% | 55% or more | Same order | Same order | Same order | Giant and Authority reversed |
The order held in 11 of 12 engine-and-threshold tests. Under the higher Gemini cutoffs, the Giant rate was 9.8% and the Authority rate was 11.5%. Those cells contained only 2 Giant websites and 4 Authority websites, so this is a small-sample exception rather than evidence of a stable reversal.
Appendix B. The Fixed Platform Group
These 20 websites are the fixed platform group used throughout the report. The group combines social networks, user-generated-content sites, reference sites, marketplaces, directories, and several large cross-topic publishers.
| Domain | Maps present (of 42) | Maps where it covers 5%+ | Maps where it is a Giant | Top-20 slots | Share of all slots |
|---|---|---|---|---|---|
| youtube.com | 42 | 40 | 12 | 17,690 | 3.31% |
| reddit.com | 42 | 38 | 9 | 12,618 | 2.36% |
| facebook.com | 41 | 28 | 6 | 11,166 | 2.09% |
| instagram.com | 38 | 15 | 1 | 5,090 | 0.95% |
| linkedin.com | 37 | 13 | 2 | 4,790 | 0.89% |
| tiktok.com | 29 | 8 | 0 | 3,698 | 0.69% |
| pmc.ncbi.nlm.nih.gov | 30 | 18 | 2 | 3,576 | 0.67% |
| medium.com | 29 | 9 | 0 | 2,370 | 0.44% |
| quora.com | 34 | 19 | 0 | 2,318 | 0.43% |
| sciencedirect.com | 30 | 15 | 0 | 2,071 | 0.39% |
| researchgate.net | 38 | 10 | 0 | 1,653 | 0.31% |
| yelp.com | 13 | 4 | 0 | 1,453 | 0.27% |
| amazon.com | 23 | 6 | 0 | 1,104 | 0.21% |
| healthline.com | 14 | 7 | 0 | 949 | 0.18% |
| en.wikipedia.org | 36 | 8 | 0 | 785 | 0.15% |
| mdpi.com | 24 | 6 | 0 | 751 | 0.14% |
| scribd.com | 29 | 3 | 0 | 529 | 0.10% |
| mayoclinic.org | 14 | 5 | 0 | 504 | 0.09% |
| pubmed.ncbi.nlm.nih.gov | 25 | 5 | 0 | 440 | 0.08% |
| webmd.com | 13 | 5 | 0 | 364 | 0.07% |
| Total | 32 | 73,919 | 13.8% |
A Giant ranks in the top 20 for at least half of a map’s queries. Six of these 20 websites reach that level in at least one map, and they account for 32 of the 45 Giant placements in the study. The other 13 placements belong to non-platform websites.
mayoclinic.org, webmd.com and healthline.com are the clearest judgment calls. Excluding them changes the group’s share of top-20 positions from 13.8% to 13.5%.
About This Study
Floyi is the topical authority platform. Three things in this report came straight out of it: the topical maps that define each query set, the Google rank tracking behind ranked coverage and the AI answer records behind the citation counts. The tiers were computed for this study from that data.
This report doesn’t show that broader ranked coverage causes AI citations, and it doesn’t set out a publishing sequence that closes the gap. It measures where a website currently ranks across a defined topical scope, which is the step that has to come first.