
See What Google Actually Sees.
Mapped to Your Strategy.
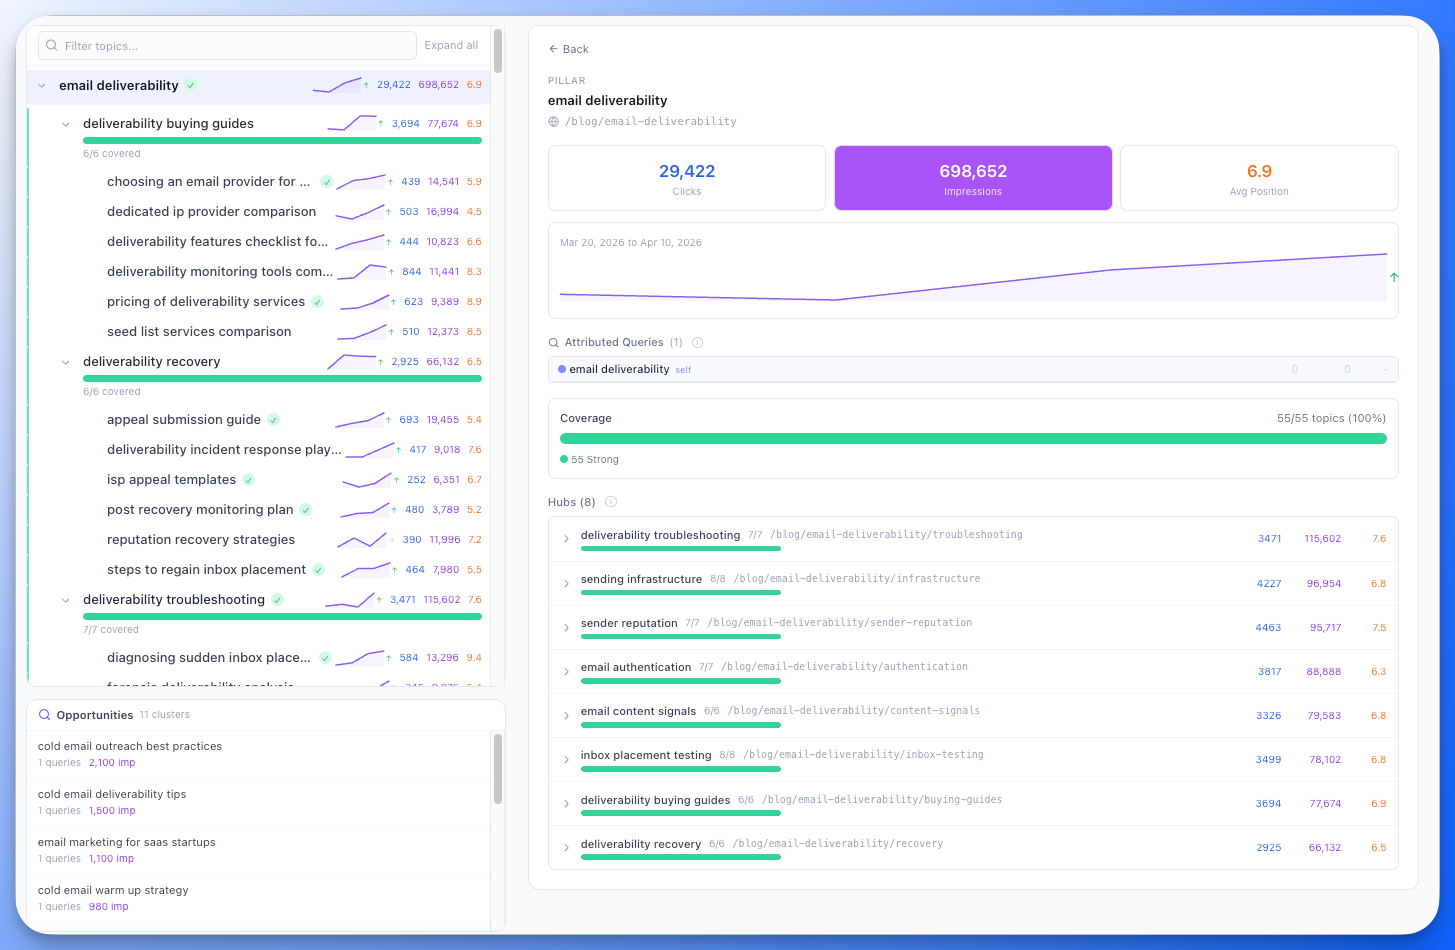
Connect Google Search Console and attribute real clicks and impressions to every topic in your map. Stop guessing which topics earn traffic — let the data show you.
Attribution Engine
Three Layers of Matching. Zero Blind Spots.
From Raw Queries to Strategic Insight
Google Search Console gives you thousands of queries. The Organic Audit maps every one of them to your topical hierarchy so you see traffic at the strategy level, not the keyword level.Phase 1 — Exact Match
Direct keyword-to-query matching for precise attribution. If your topic keyword appears in a GSC query, it is matched immediately.
Phase 2 — Stemmed Match
Matches different word forms automatically. "Optimize" matches "optimizing", "optimizer", and "optimized" so no traffic slips through the cracks.
Phase 3 — Semantic Matching
semantic matching connects conceptually related queries to topics, even when the exact words differ. Only high-confidence matches count.
Growth Discovery
Find Topics You Did Not Know You Needed
Your Audience Already Told You What to Write
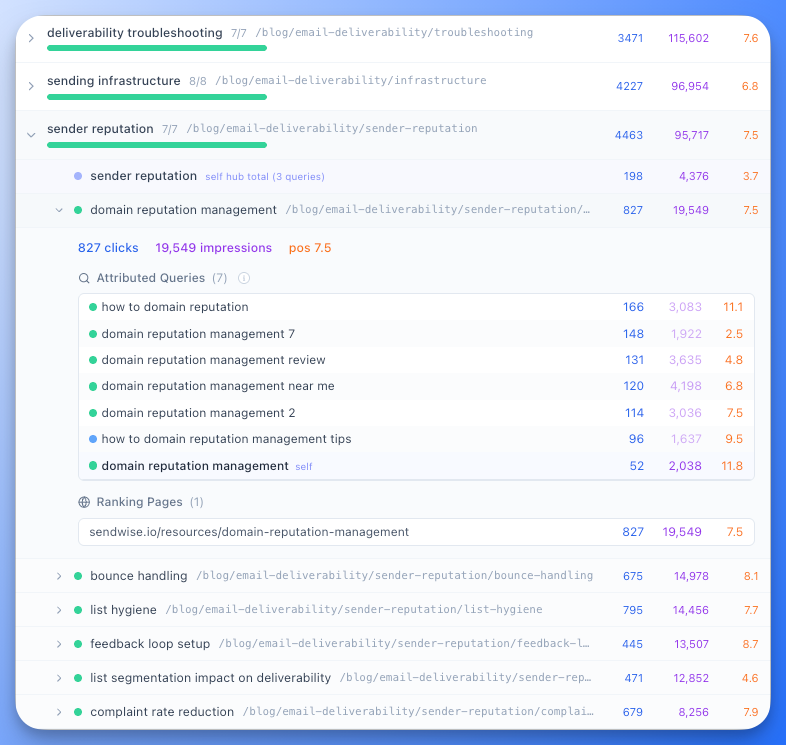
Opportunity clusters surface real queries your audience uses that you have not covered yet. Expand your map with data, not guesses.Unmatched Query Grouping
GSC queries that do not match any topic in your map are automatically grouped into clusters based on semantic similarity.
Add as New Topic
Each opportunity cluster includes an "Add as New Topic" button. Expand your topical map directly from real search data in one click.
Data-Driven Expansion
Stop guessing which topics to add next. Your audience is already searching for these queries — now you can see them and act on them.
Four Views, One Audit
Priority, By Topic, By Page, and Visual Map
Toggle Between Strategy and Pages
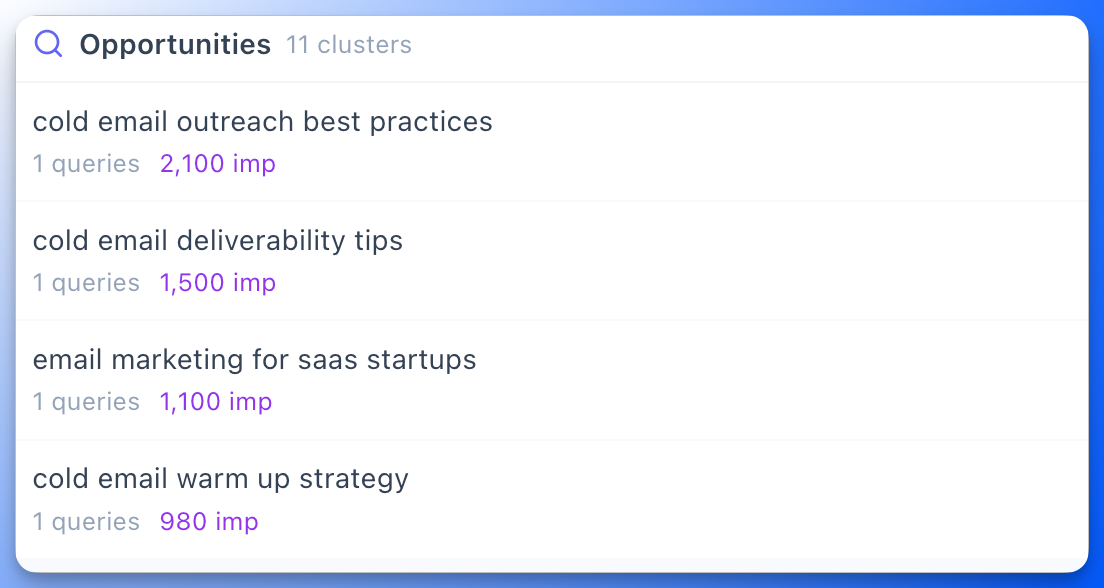
Four tabs, one import. Priority surfaces actionable signals. By Topic shows your hierarchy and where you stand against your map. By Page shows every URL ranked by traffic. The Visual Map shows it all overlaid with actual GSC results — with competitor comparison to see where you lead and where they do.By Topic — Two-Panel Hierarchy
Browse your topical map with per-node clicks, impressions, and coverage bars on the left. Drill into any node on the right to see queries, landing pages, and match confidence. Best for strategy reviews.
By Page — Flat Page Table
See every URL on your site with GSC data in one sortable table. Sort by clicks, impressions, or position. Click any row to expand the queries driving that page. Best for page-level audits and cannibalization checks.
Manual Topic Matching
When automatic attribution misses a page, click "+ Match" in the By Page view to link a URL to a topic — and optionally sync the topic's URL slug at the same time. Matches persist across future imports.
Sparkline Trends
Run multiple imports over time to see per-topic impression trends as inline sparklines. Spot momentum shifts before they surface in aggregate rankings.
Full Data Export
Download query-level and page-level attribution data as CSV for reports, client deliverables, and offline analysis.
Actionable Signals
Stop Scrolling. Start Acting.
The Priority Tab Surfaces What Matters
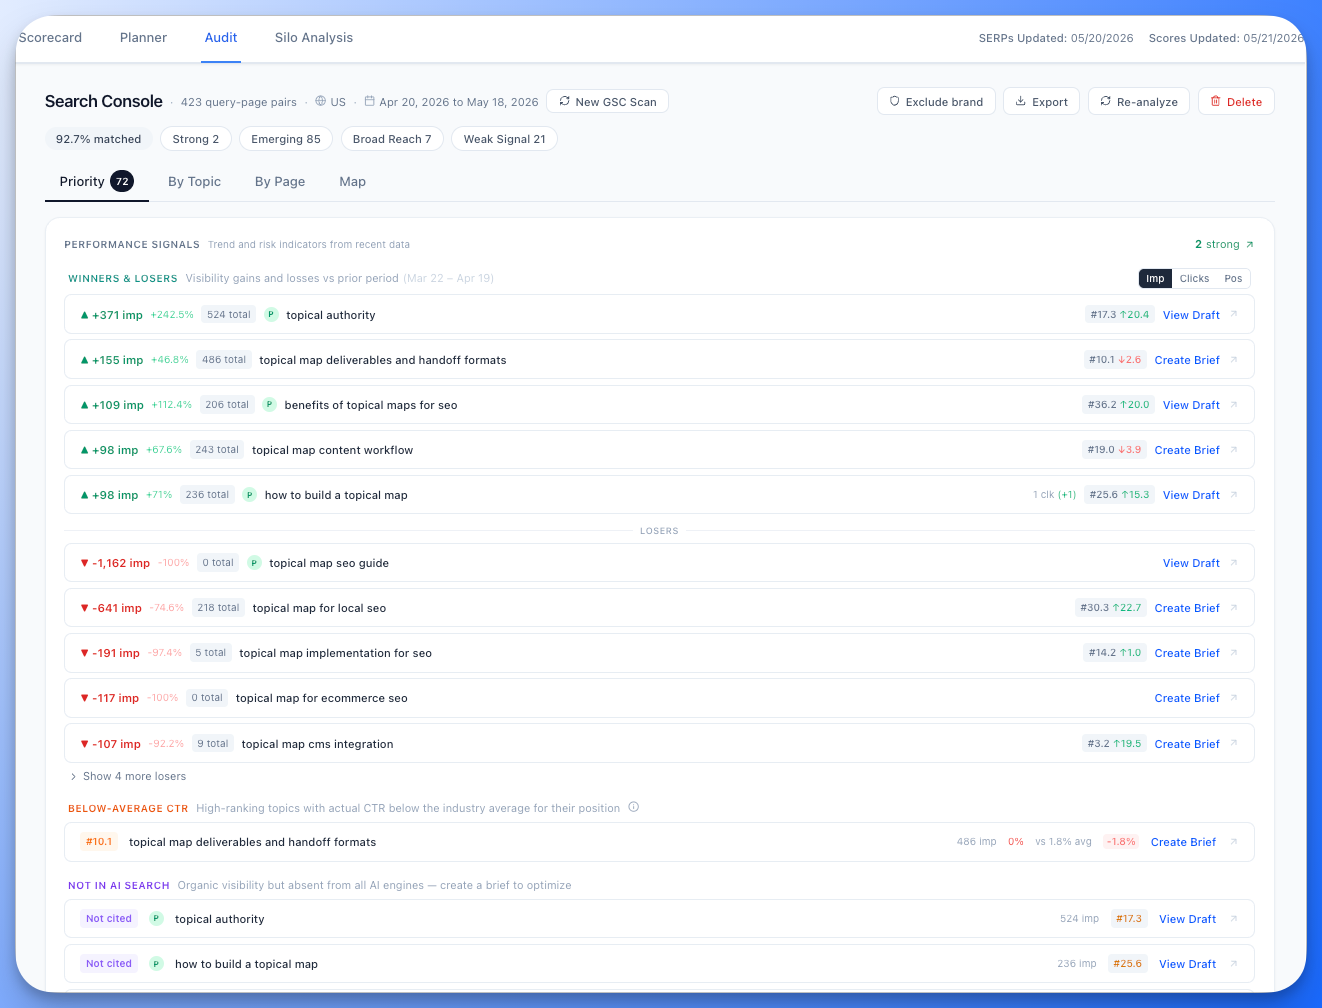
The Priority view distills your GSC data into three actionable signal groups: topics gaining or losing visibility, topics ranking high but bleeding clicks, and topics invisible to AI search engines. Every row has an action button so you can move from insight to brief or draft without switching tabs.Winners & Losers
See which topics gained or lost the most impressions, clicks, or positions compared to the prior period. Each row shows the delta, total metrics, and a direct action button (View Draft, Create Brief).
Below-Average CTR
Topics that rank well but underperform on click-through rate. Your position earns visibility — your snippet is not converting it. Fix the title and meta to reclaim those clicks.
Not in AI Search
Topics with organic visibility but zero presence across AIO, AI Mode, ChatGPT, and Gemini. These are your best candidates for AI search optimization.
See Your Map
Your Entire Topic Map. One Glance.
A Map You Can See Is a Map You Can Win
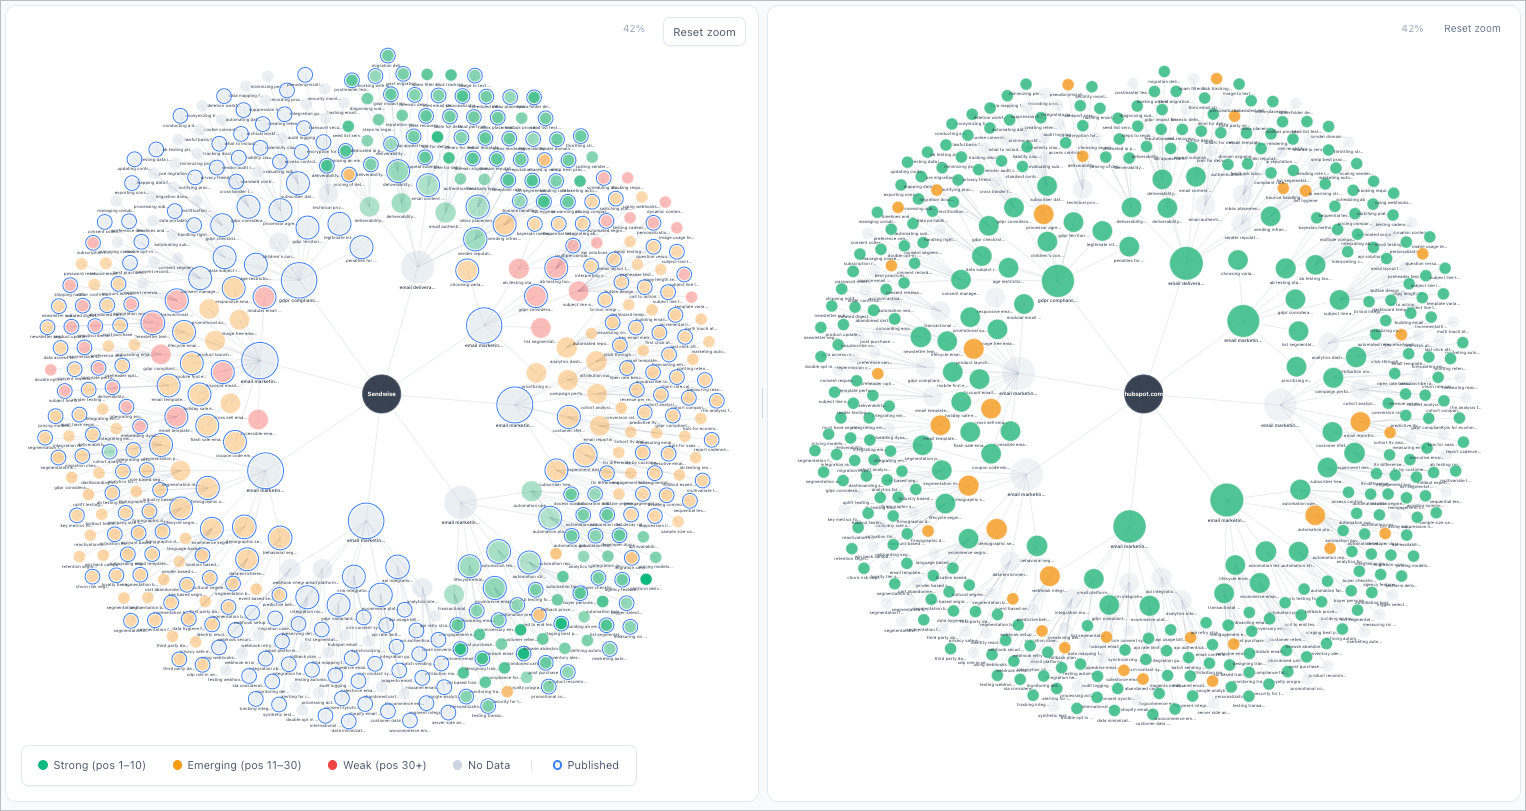
Your entire topical map overlaid with actual GSC results. Clusters of red nodes expose under-performing silos. Scattered blue rings show where execution is happening versus where it is missing. Compare your map side-by-side with any tracked competitor, or switch to gap overlay to see contested vs. owned territory at a glance.Your Full Topical Map, Visualized
Your brand at the center, pillars radiating outward, with hubs, branches, and resources sized by importance — all overlaid with actual GSC performance data. The layout stays readable at any map size.
Color by Position, Impressions, Clicks, or AI Search
Switch the color mode to instantly see ranking health (green/amber/red), traffic volume, click performance, or AI surface presence (cited/mentioned/not present) across every topic.
Published Rings & Interactive Legend
Blue rings mark published topics so you can see execution progress at a glance. Click any legend swatch to filter the map to that category only.
Click, Double-Click, Drag, Zoom
Click to highlight a node and its connections. Double-click to jump to that topic in the Planner. Drag to rearrange. Scroll to zoom. Drag background to pan.
Competitor Comparison
Side-by-Side mode places your brand next to any tracked competitor on the same topology with synchronized zoom and resizable panels. Gap Overlay recolors a single map by who wins each topic — green where you lead, red where they lead.
See Your Organic Traffic Through the Lens of Your Strategy
The Organic Audit maps Google Search Console data to your topical map so every metric connects to a strategic decision.
Priority Signals
Winners & losers, below-average CTR, and topics not in AI search — the three signal groups that turn GSC data into immediate action items with one-click briefs and drafts.
GSC Attribution Engine
Smart matching (exact keywords, word forms, and meaning-based) maps every GSC query to your topical map nodes with confidence scores.
Performance Classifications
Every topic is classified as Strong, Emerging, Broad Reach, or Weak Signal. Filter the hierarchy to focus on what matters.
Opportunity Clusters
Unmatched queries are grouped into new topic suggestions. Add them to your map in one click from real search data.
Two-Panel Hierarchy (By Topic)
Browse your topic tree with per-node clicks, impressions, and coverage bars. Click any node for detailed query-level data.
By Page View
A flat sortable table of every URL with GSC data. Search by URL, expand any row for queries, and manually match pages to topics when attribution misses them.
Per-Topic Search Console Panel
Open any topic in the Planner's topic details drawer and see its matched URL, total clicks and impressions, top queries, and impression sparklines — without leaving the planning view.
Sparkline Trends
Per-topic impression trends displayed as inline sparklines. Spot momentum shifts at a glance across your entire map.
One-Click GSC Connection
Connect Google Search Console with OAuth (read-only access). Select your property, choose a date range, and fetch data in one click.
Match Confidence
Every attribution shows its match phase and confidence score so you can trust the data and investigate edge cases.
CSV Export
Download query-level and page-level attribution data for reports, client deliverables, and offline analysis.
GSC Queries in the Content Optimizer
GSC queries flow directly into the Content Editor & Optimizer. Open any published page and see which queries your content covers, highlight all queries at once, and copy individual queries — so you can optimize toward real search demand.
Visual Map
Your entire topical map overlaid with actual GSC results. Nodes sized by importance and color-coded by position, impressions, clicks, or AI search presence. Published topics show blue rings. Competitor comparison: side-by-side mode or gap overlay to see who wins each topic.
Strategy Validation
Confirm whether your topical map aligns with actual search demand. See which topics your audience cares about and which they do not.
How It Works
From Search Console to strategic insight in four steps.
Step 1: Connect Google Search Console
Authorize via OAuth with read-only access. Select your property and date range, then fetch data in one click.
Step 2: Run the attribution engine
Smart matching connects GSC queries to your topical map using exact keywords, word form variants, and semantic matching.
Step 3: Read the classifications
Every topic is classified as Strong, Emerging, Broad Reach, or Weak Signal. Filter and sort to find the topics that need attention.
Step 4: Act on the insights
Double down on Strong topics, optimize CTR on Broad Reach, investigate Weak Signals, and add Opportunity Clusters as new topics to your map.
Common Questions
What is the Organic Audit?
The Organic Audit connects your Google Search Console data to your Topical Map. It attributes real clicks and impressions to each topic using smart query matching so you can see which topics earn organic traffic and which are invisible to Google.
How does the smart query matching work?
Phase 1 matches GSC queries to topics by exact keyword. Phase 2 catches different word forms automatically. Phase 3 uses semantic matching for conceptually related queries, even when the exact words differ. This layered approach maximizes coverage while keeping attribution accurate.
How do I connect Google Search Console?
Click Connect Google Search Console in the Audit tab, sign in with your Google account, and grant Floyi read-only access. Select your property, choose a date range, and click Fetch Data.
What are the performance classifications?
Every topic is classified based on match confidence and search volume: Strong (proven winners), Emerging (growing momentum), Broad Reach (visibility without conversion), and Weak Signal (early stage or underperforming).
What are Opportunity Clusters?
GSC queries that do not match any topic in your map are grouped into opportunity clusters. Each cluster represents a potential new topic. Click "Add as New Topic" to expand your map directly from real search data.
How is this different from looking at GSC directly?
Google Search Console shows raw queries and pages. The Organic Audit maps that data onto your topical strategy. Instead of scanning thousands of queries, you see clicks, impressions, and trends organized by pillar, cluster, and topic.
Can I track trends over time?
Yes. Run multiple imports and each topic shows sparkline trends for impressions. Spot momentum shifts at the topic level before they appear in aggregate rankings.
How does this connect to the rest of Floyi?
The Organic Audit lives inside Topical Authority alongside the Scorecard, Silo Analysis, Planner, and Visual Map. Topics classified as Weak Signal or Broad Reach can be sent directly to Briefs and Drafts. GSC queries also flow into the Content Editor & Optimizer, where you can optimize published pages toward the queries searchers actually use. The Visual Map shows your entire topical map overlaid with actual GSC results with competitor comparison — instant map health and competitive landscape visibility.
What is the Visual Map?
The Visual Map shows your entire topical map overlaid with actual GSC results. Nodes are sized by importance and color-coded by SERP position, impressions, clicks, or AI search presence. Published topics show a blue ring. Click any node to highlight connections, double-click to jump to the Planner, and use the legend to filter by category. Competitor Comparison lets you view any tracked competitor side-by-side on the same topology, or switch to Gap Overlay to see who wins each topic. It reads the same GSC, SERP, and AI search data — no extra credits.
What is the Priority view?
The Priority view surfaces the most actionable signals from your GSC data in three groups: Winners & Losers (topics with the largest impression gains or losses), Below-Average CTR (high-ranking topics underperforming on clicks), and Not in AI Search (topics with organic visibility but absent from all AI engines). Every row has a direct action button.
What is the By Page view?
By Page is a sibling view to By Topic. It lists every URL with GSC data in a flat sortable table — clicks, impressions, average position, and the topic each page is matched to. Click any row to expand the queries driving that page. Use it for page-level audits, cannibalization checks, and fixing attribution.
Can I manually match a page to a topic?
Yes. In the By Page view, click "+ Match" in the Topic Match column to link a URL to a topic node. You can optionally sync the topic's URL slug at the same time so future audits attribute it automatically. Manual matches persist across imports.
Can I see GSC data for a single topic without leaving the Planner?
Yes. Open any Resource-level topic in the Planner's topic details drawer and expand the Search Console section. You'll see the matched URL, total clicks and impressions, top queries, and impression sparklines for that topic. If the topic has no matched URL yet, click "+ Match a URL" to pick one.
Your Traffic Data Has the Answers. Map It to Your Strategy.
Connect Google Search Console and see which topics earn real traffic, which are invisible, and where your next growth opportunity is hiding.