
The X-Ray for Content Strategy
Paste any URL. In minutes, see the exact Pillar-Hub-Branch topical structure that drives their SEO. Reverse-engineer any competitor's roadmap.
Strategy Discovery
Don't Just See Pages. See The Plan.
Reverse-Engineer Authority
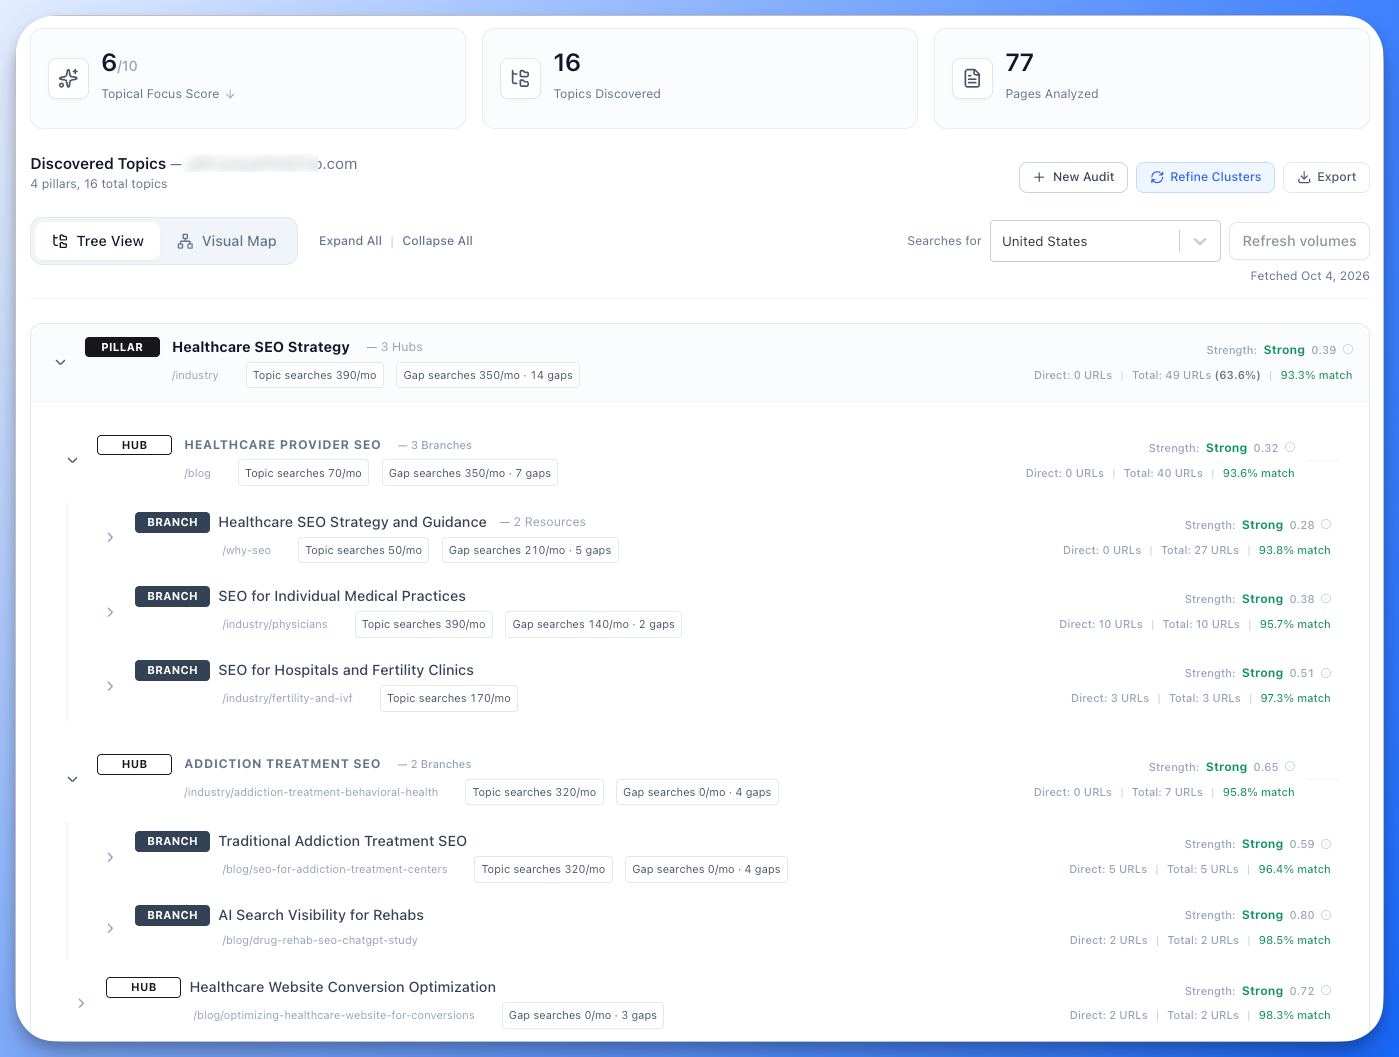
See exactly how competitors structure their content to dominate niches. No sitemaps required. Our crawler discovers the map for you.4-Level Semantic Hierarchy
Most tools just show a flat list of URLs. Floyi auto-clusters every page into a strategic architecture: Pillars (L1), Hubs (L2), Branches (L3), and Resources (L4).
Semantic Clustering
We use vector embeddings to group content by meaning, not URL structure.
Centroid Identification
Automatically pinpoints the "Core Page" that defines each cluster, so you know exactly which page is anchoring the topic.
Gap Analysis
Find What They Missed
Steal Their Strategy. Fill Their Gaps.
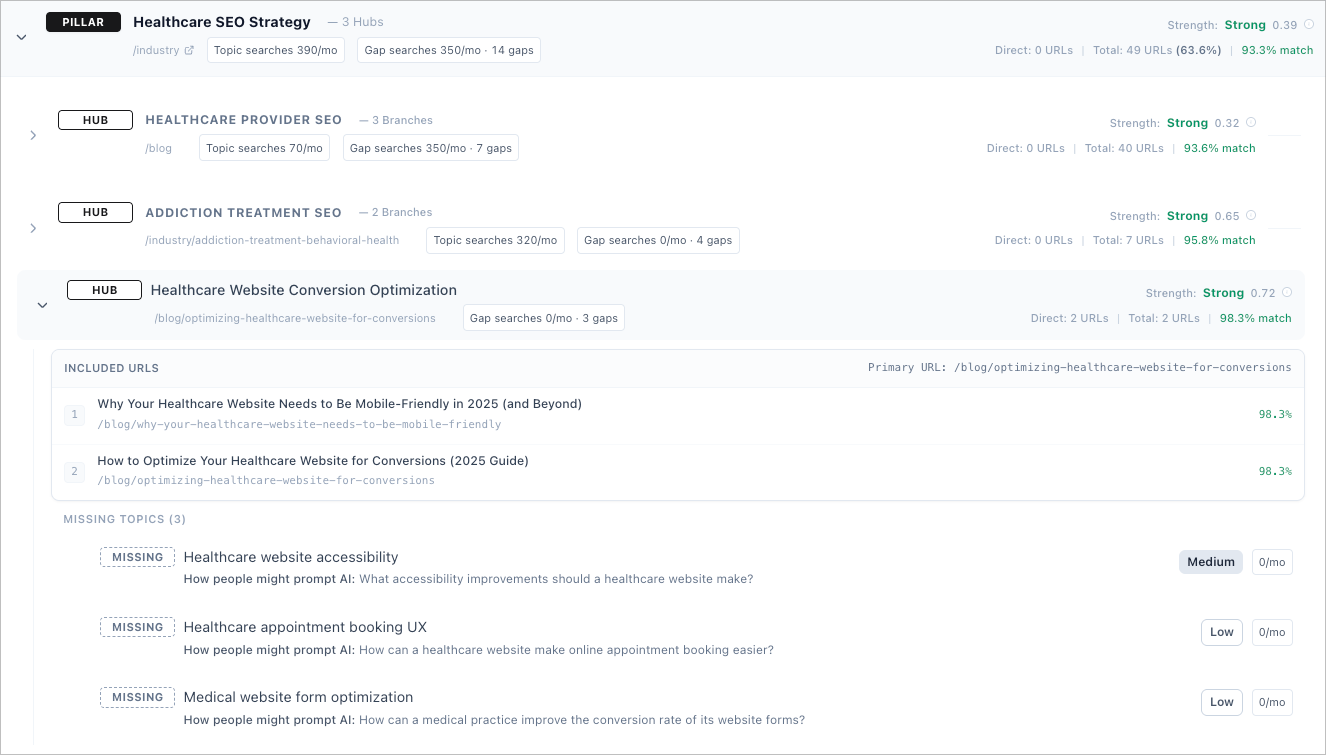
Stop guessing what to write next. Priority Topics - Write Next ranks the 15 missing topics to write first, so your competitor's missed opportunities become your roadmap to outrank them.Missing Topics In The Tree
Every topic the site is missing sits right under the pillar, hub or branch where it belongs, so you see the gap in context, not in a loose list.
Topical Priority
Each missing topic is rated High, Medium or Low by how much it would strengthen what the site already covers, with the reasons spelled out.
Search Volume
See every search behind a missing topic and its monthly volume, in 45 countries, plus how people might prompt AI about it.
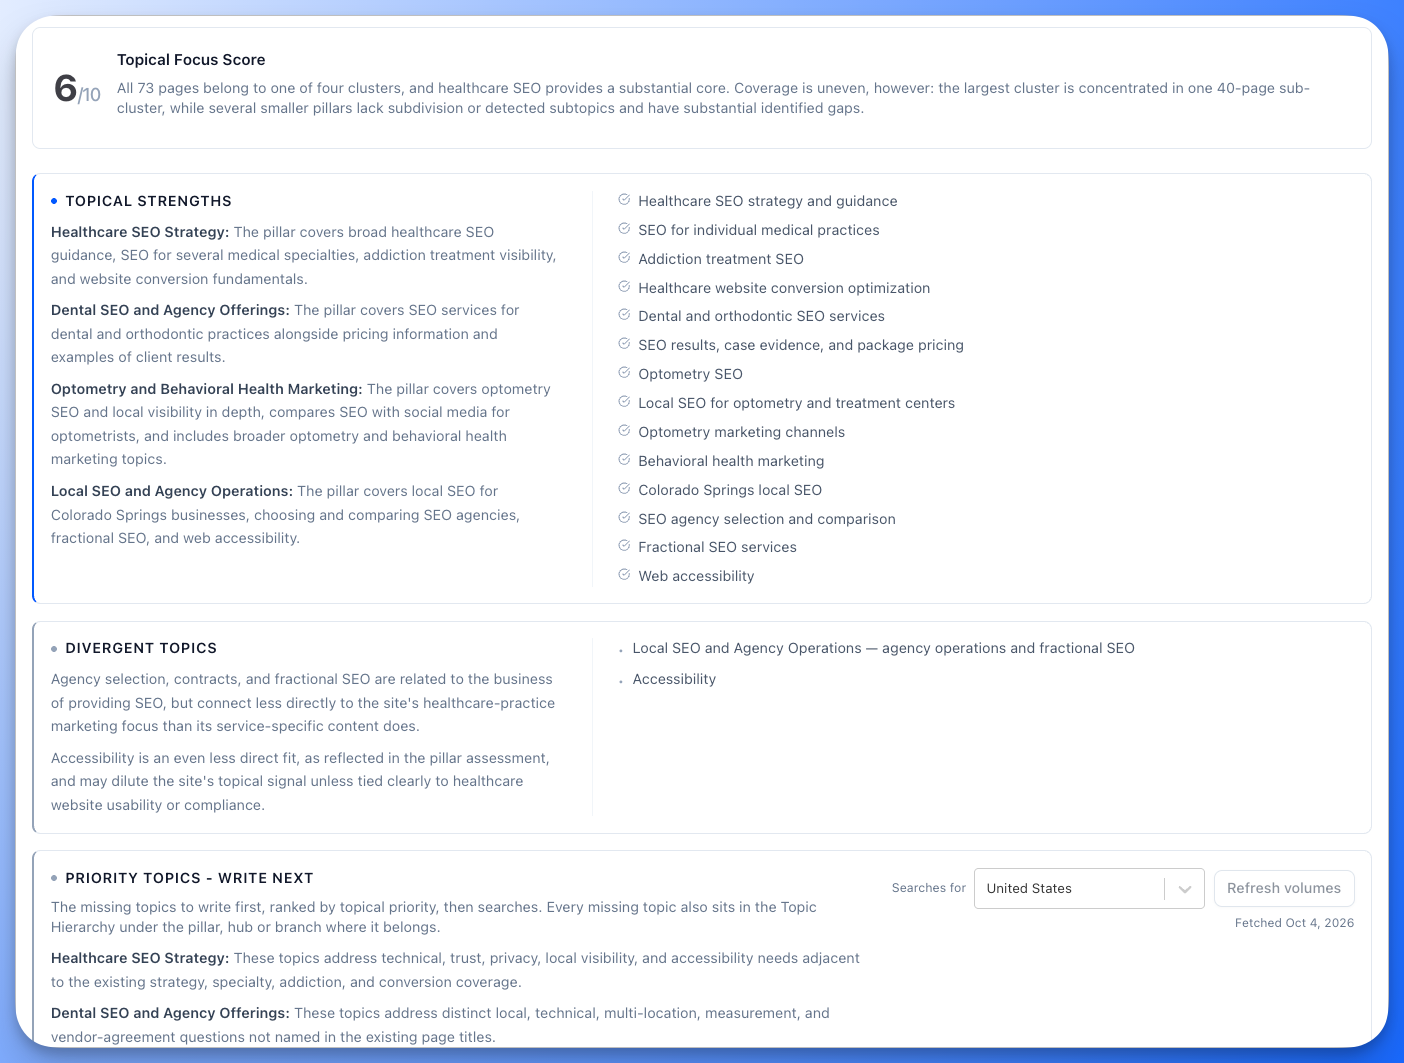
Topical Focus Score
Get a 0-10 grade on how focused their strategy is. Spot "kitchen sink" blogs vs. disciplined authorities instantly.
Divergent Topic Detection
Identify content that drifts from the core strategy (Similarity < 80%). See where they are diluting their own authority.
Priority Topics
Know What To Write First
Turn Gaps Into A Publishing Queue
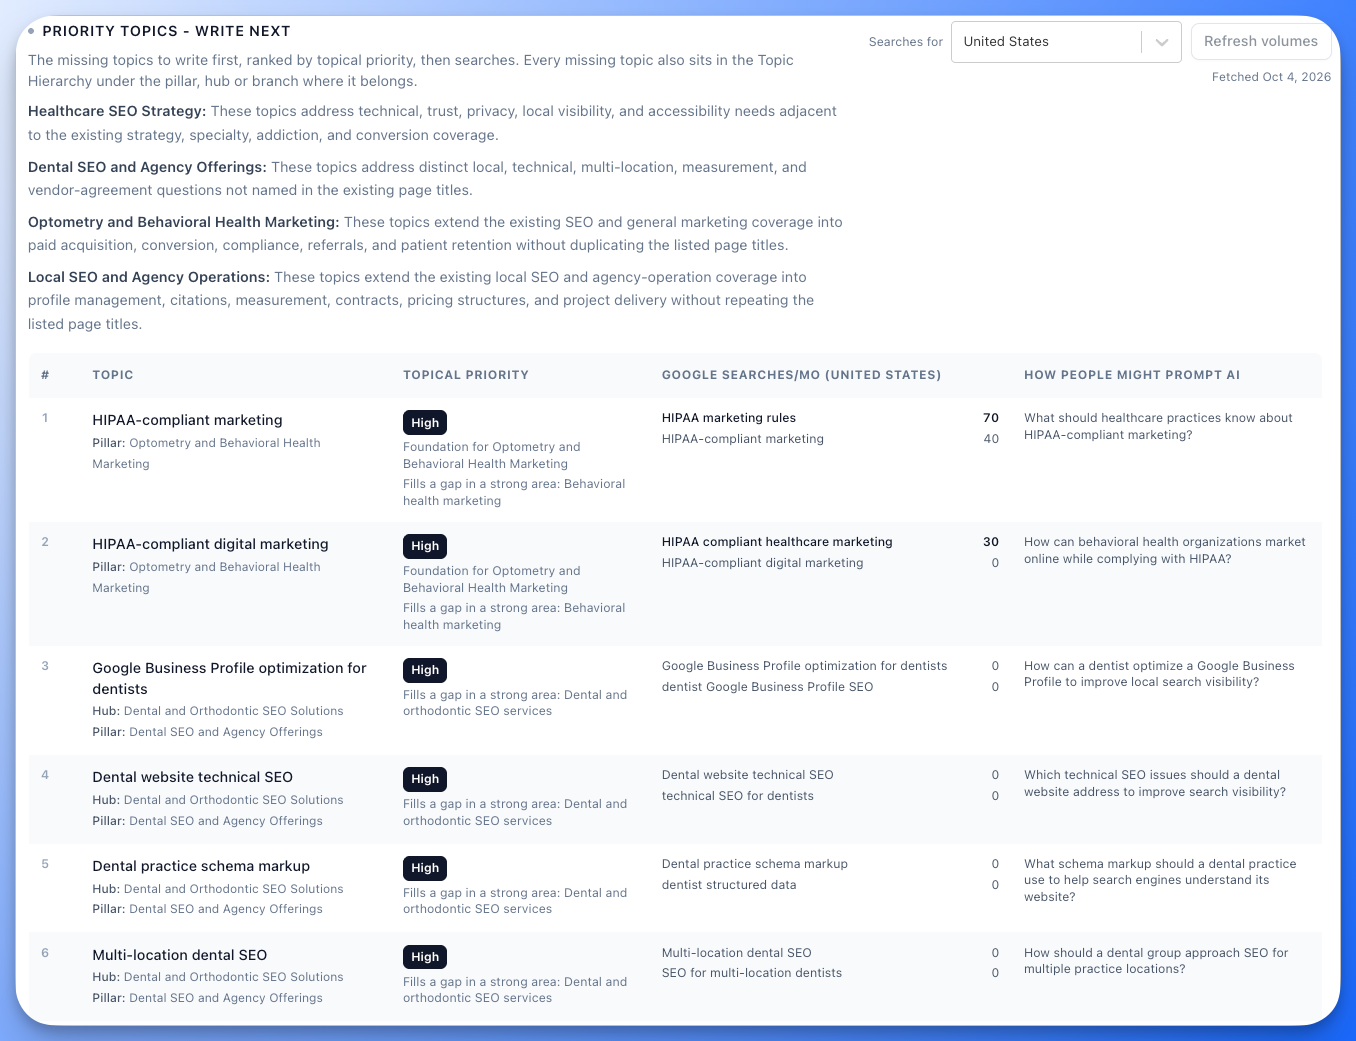
Priority comes from how each topic strengthens what the site already covers. Search volume tells you how often people look for it. Together they give you a ranked list you can hand straight to your writers.Ranked For You
Priority Topics - Write Next lists the 15 missing topics to write first, ranked by topical priority and then by searches, with where each one belongs in the hierarchy.
Every Search, Every Volume
Each topic shows every way people search for it and the monthly search volume for each, so you can pick the wording people actually use.
Your Market, Your Numbers
Switch between 45 countries. Countries you have already fetched switch instantly, and each one shows when its volumes were fetched.
Visual Map
See The Whole Structure At Once
Read The Shape, Not Just The List
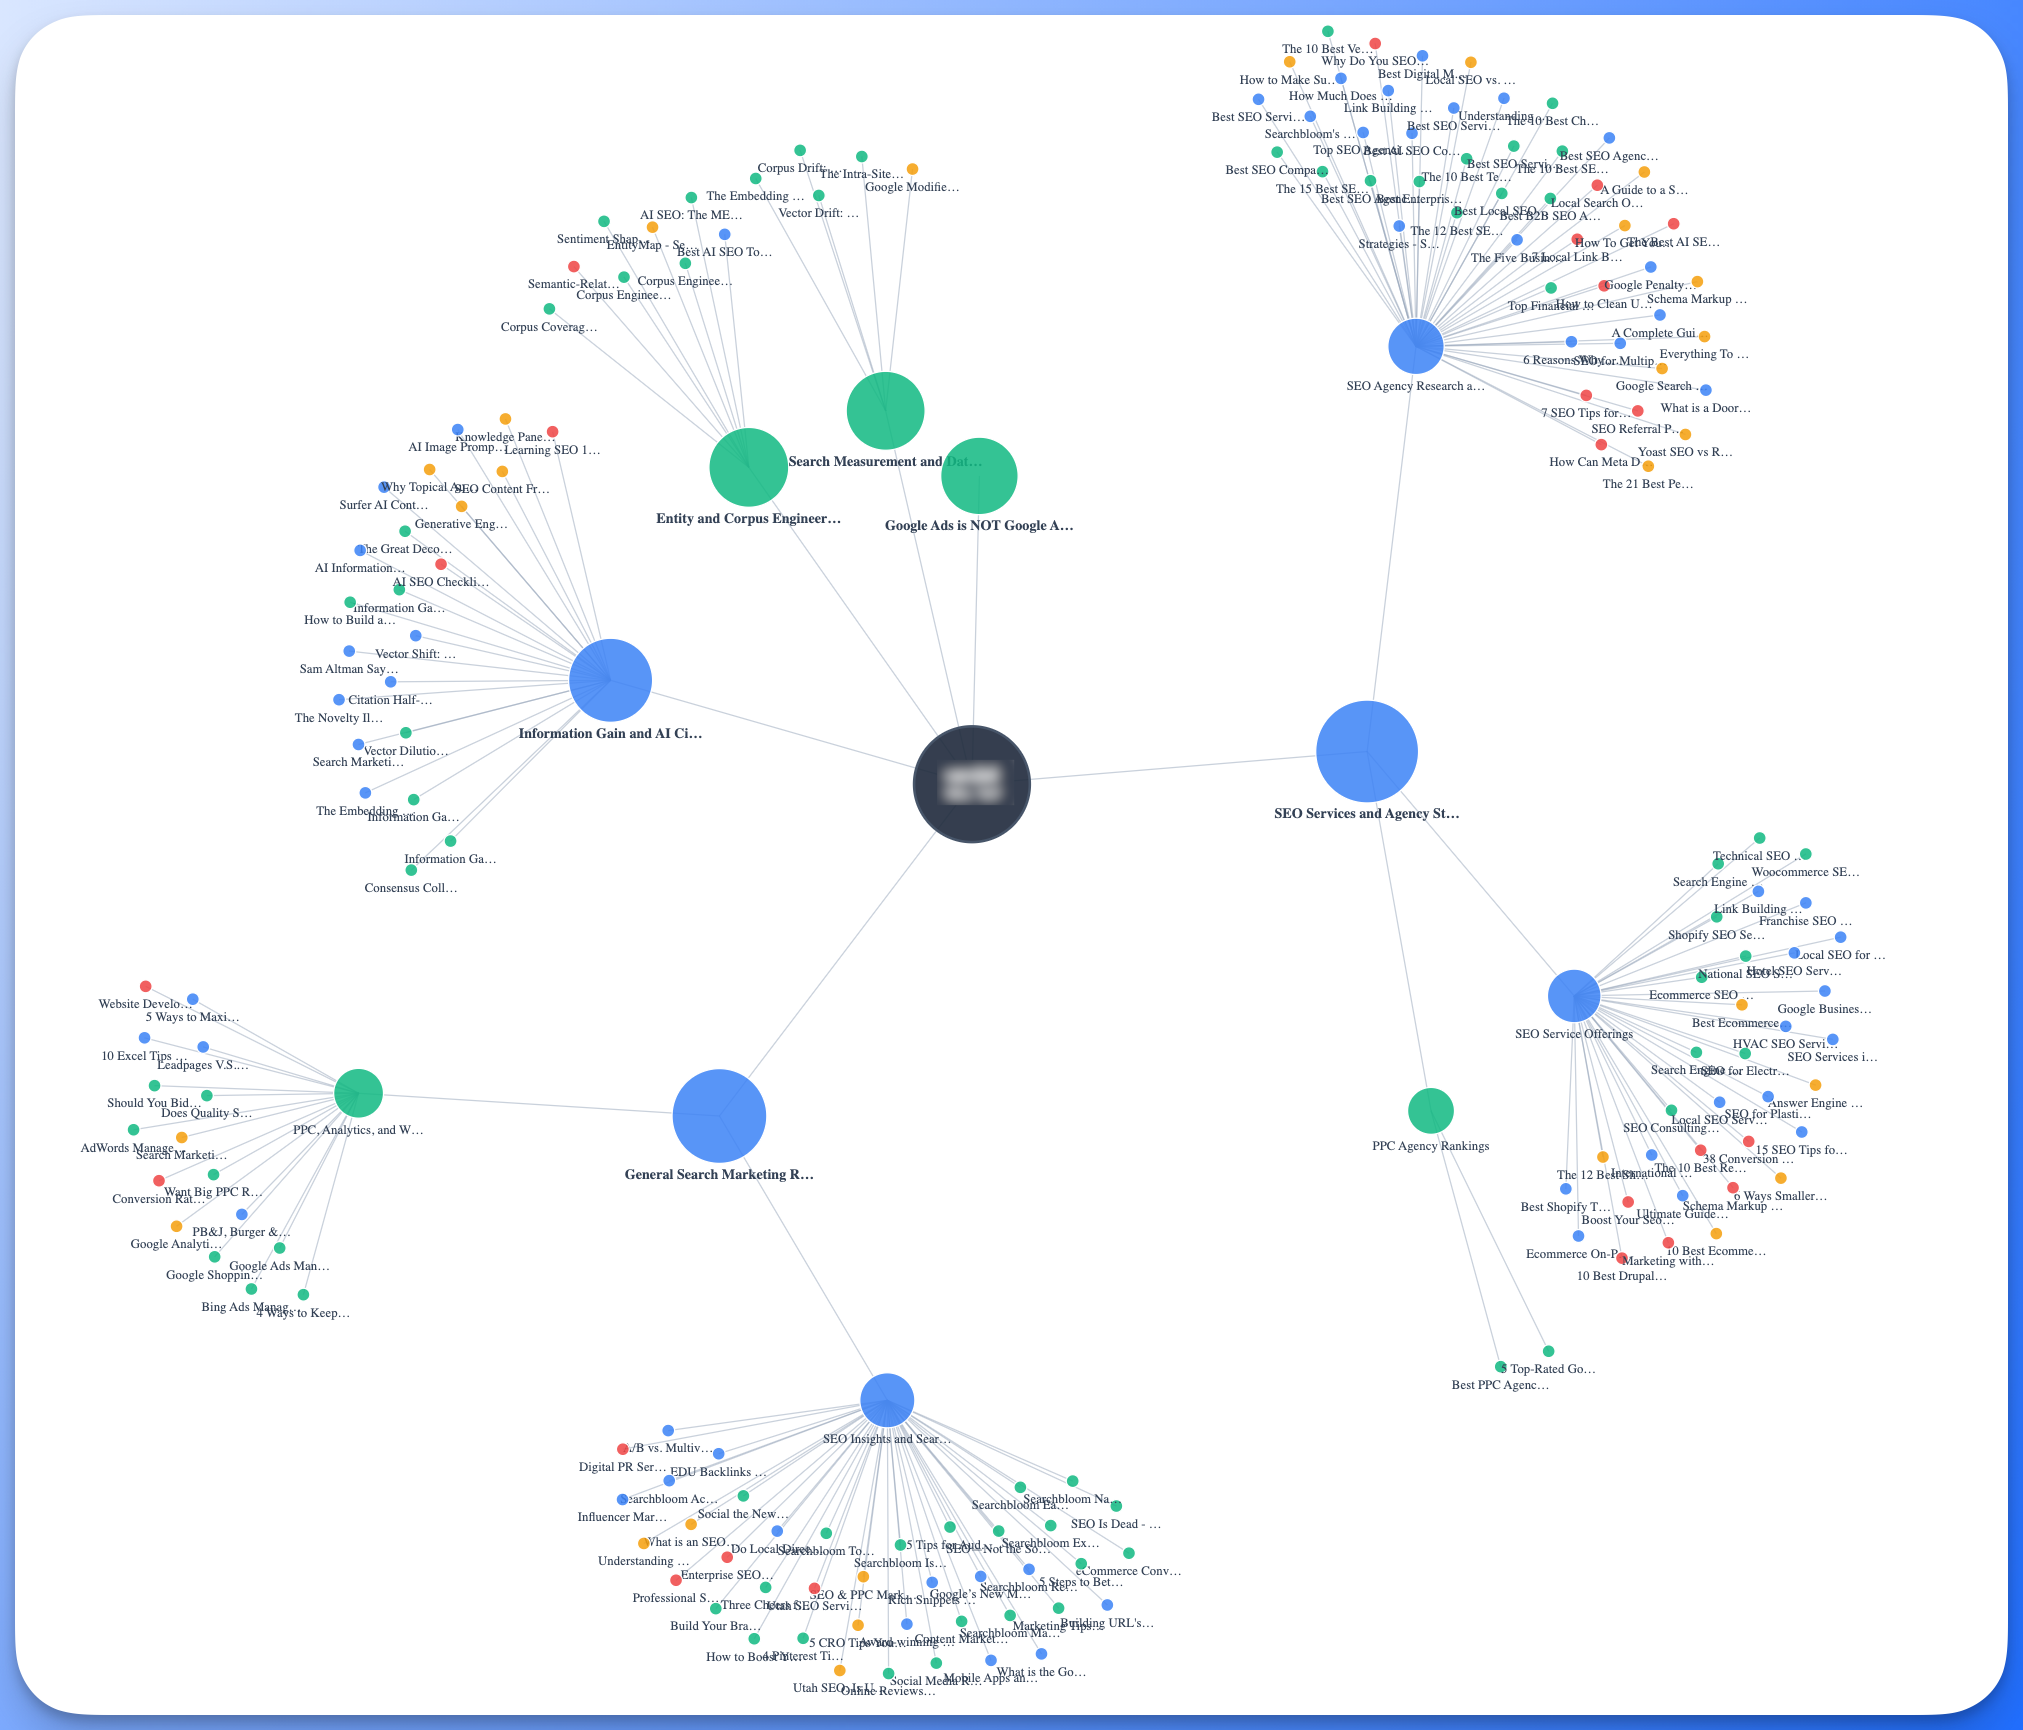
A tree tells you what the audit found. The map shows you the shape of it: the site at the center, pillars radiating outward, and each topic's subtopics always sitting behind it. Turn on pages when you want to see where the volume actually went.Color by Topic Strength
Every topic is shaded by how cleanly it separates from its neighbors. Weak and overlapping topics surface immediately instead of hiding in a table.
Topics First, Pages On Demand
The map opens as pure structure. Check Show pages and every analyzed page drops onto the topic it was grouped into, so a pillar carrying far more or far fewer pages than expected is obvious at a glance.
Built For Big Sites
A thousand-page audit still reads as a shape, not a hairball. Zoom, pan, isolate a topic and its connections, expand to fullscreen, and export the map as a PNG for your report or deck.
Paste URLs
Audit The Exact Pages You Choose
Bring Your Own URL List
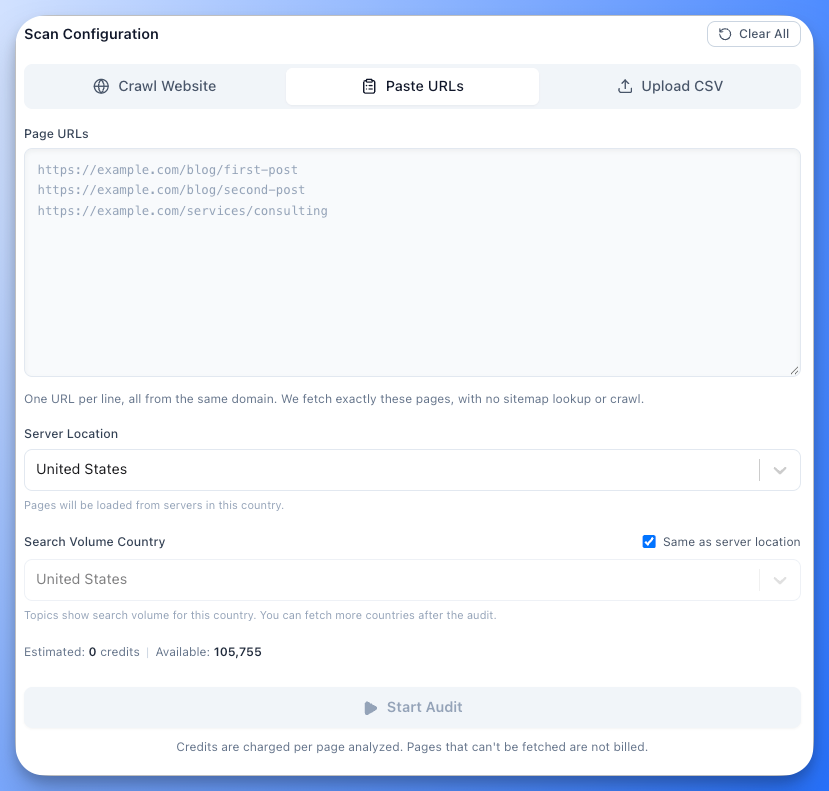
Pull the list from a CMS export, Google Search Console or your own crawler and paste it in. Floyi groups those pages into the same four-level hierarchy as a full crawl.Skip The Sitemap
Paste a list of page URLs and Floyi fetches only those pages. No sitemap lookup and no link-following crawl.
Get Past Blocked Sitemaps
When a firewall blocks the sitemap or the crawler but the pages still load, paste the list and the audit runs anyway.
See The Cost Before You Start
Duplicates are removed and invalid lines are flagged. The page count and credit estimate update as you paste.
Universal Scanning & Export
From discovery to boardroom-ready reports in minutes.
Universal Crawling
Competitor? Client? Legacy site? If it's public, we can map it. Handles redirects, trailing slashes, and HTTP/HTTPS automatically.
No Sitemap Needed
Smart "Force Crawl" mode discovers pages by following links, even if no XML sitemap exists.
Paste Your Own URLs
Paste the exact pages you want analyzed. Floyi fetches only those pages, with no sitemap lookup and no crawl.
Excel & Google Sheets
Export the full hierarchy, page counts, scores and every missing topic with its priority and search volume to .xlsx or Google Sheets.
Board-Ready Reports
Generate polished PDF, Word, or HTML reports with the strategy summary and the priority topics to write next, or send them straight to Google Docs.
Tree or Visual Map
Read results as a drill-down hierarchy or as an interactive map of the site's topical structure. Toggle individual pages on or off, and export the map as a PNG.
Multi-Language Ready
Auto-detects content language for accurate semantic clustering, and pulls search volume for 45 countries.
Smart Filtering
Exclude non-content pages (Homepages, categories, excessive tags) to keep the map clean.
Common Questions
How is this different from Organic Audit?
Organic Audit connects Google Search Console data to your topical map to show real clicks, impressions and position (Validation). Topical Audit discovers unknown maps from any website (External/Discovery). Full details are in the Topical Audit documentation.
Do I need a sitemap?
No. If a website lacks a sitemap, our Force Crawl mode follows internal links to find pages automatically. If the sitemap and crawl miss pages, or a firewall blocks them, switch to Paste URLs and list the pages yourself. Floyi fetches exactly those pages.
What does the Topical Focus Score mean?
It is a 0-10 rating of strategy focus for the whole site. A score of 8-10 means the site stays strictly on-topic. 1-4 indicates scattered, "kitchen sink" content that confuses search engines. Individual topics get their own Topic Strength band, which shows how cleanly each one separates from its neighbors.
What is the Visual Map?
A second way to read any audit. Instead of a hierarchy list, you get an interactive picture of the site's topical structure: the site at the center, pillars radiating outward, and every subtopic sitting behind its parent. It opens as topics only. Check Show pages to drop every analyzed page onto the topic it was grouped into. Color it by Topic Strength and weak or overlapping topics stand out at a glance.
How do I know which missing topics to write first?
Start with Priority Topics - Write Next. Topical priority shows how much each missing topic would strengthen what the site already covers, and search volume shows how often people search for it. Priority never depends on search volume, so a topic people mostly ask AI assistants about can still rank High.
Which countries does search volume cover?
Forty-five countries. Pick one before the audit starts and that first lookup is included. You can switch to other countries after the audit, and countries you have already fetched switch for free.
Can I audit subfolders?
Yes. You can enter
example.com/blogorexample.com/knowledge-baseto restrict the audit to that specific section.
Related Tools
Topical Authority
Measure your own authority and compare it against audited competitors.
Topical Maps
Build your own four-level map informed by competitor audit findings.
Content Plans
Turn competitor gaps into a prioritized publishing queue.
AIRS Analyzer
Track AI search visibility alongside topical audit insights.
SERP Clustering
Group keywords by intent before building your own topical map.
Briefs & Drafts
Generate briefs and drafts for the gaps you find in competitor strategies.
See The Strategy Behind The Rankings
Stop analyzing pages. Start analyzing architecture.